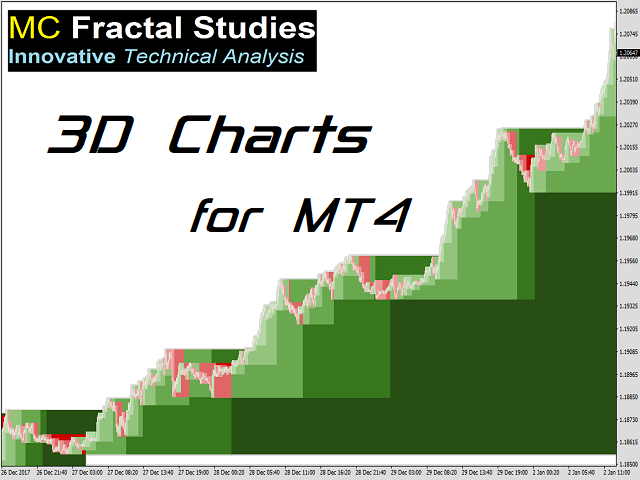
MC Fractal Studies 3D Charts for MT4
The indicator show the various supports and resistances on the chart, using different colours to differentiate them.
The lighter the colour, the smaller the wave.
The resulting effect is a nice coloured chart that gives a 3D (three dimensional) feeling.
They work on every timeframe, every market.
When the price is trending up, you will observe green colors below price.
As long as price stay above the green (supports), that particular wave-trend is UP.
When the price is trending down, you will observe red colors above price.
As long as price stay below the red (resistances), that particular wave-trend is DOWN.
The best way to use this indicator is in conjunction with one of the other MC Fractal Studies ©.
You can find them in MQL5 Market under the name MC Fractal Studies Main Indicators.
Tip: Keep MAX 5000 bars in your chart for a smooth use of MC Fractal Studies ©.
How to set max bars in your chart in your metaTrader:
Tools > Options > Charts > Max Bars in Chart: put 5000.
Then close and reopen your metaTrader 4.
本店最新上架
-
- MT4 MT5跟单EA 本地跟单远程跟单 绝不

- ¥1100.00
-
- 在MetaTrader市场购买MetaTrader 5的&#
- ¥3988.00
-
- 在MetaTrader市场购买MetaTrader 5的&#
- ¥3988.00
-
- 在MetaTrader市场购买MetaTrader 5的&#
- ¥3988.00
-
- 在MetaTrader市场购买MetaTrader 5的&#
- ¥3988.00
全网为您推荐
-
- AlgoTradeSoft

- ¥3988.00
-
- 国际期货套利软件

- ¥3988.00
-
- MT4 MT5跟单EA 本地跟单远程跟单 绝不

- ¥1100.00
-
- 在MetaTrader市场购买MetaTrader 5的&#

- ¥3988.00
-
- 在MetaTrader市场购买MetaTrader 5的&#

- ¥3988.00
 客服热线:
客服热线:


