 客服热线:
客服热线:


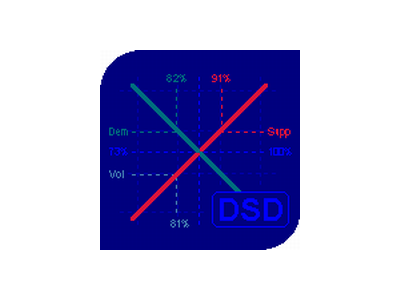
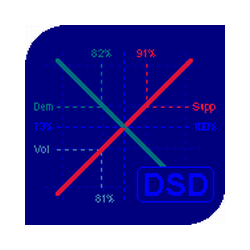


Demand And Supply Diagram MT4
The balance of supply and demand is a simple and effective market analysis method.
The supply and demand diagram can show you in advance, even before the trend reversal, where the supply ends and the demand is already emerging, where the demand ends and the supply is emerging, while substantially increasing the probability of making a deal in the right direction and with a high profit factor.
Indicator Signals
The indicator uses the price/volume values to generate signals:
- ED – excess demand.
- ES – excess supply.
- ND (No demand) – no demand (accompanied by a warning message "Sell area").
- NS – no supply (accompanied by a warning message "Buy area").
It also monitors the sequence of these signals, determines the elasticity of demand/supply to the price and gives a confirmation message "Buy point" or "Sell point".
Input Variables
- alerts – enables/disables additional showing of signals in the alert window, as well as additional push messages.
- Advise - enables/disables trading tips.
- Labels – enables/disables the display of signal labels on the chart.
- Viewing – enables/disables the full display of the diagram (alerts and Advise retain their functionality, if they are enabled).
- Position – location of the diagram along the time scale.
- Average - calculation mode of the diagram's midpoint, moving average or weighted average based on volume.
- Deviation - calculation mode of the diagram's amplitude, the maximum deviation, the standard deviation or the deviation based on the Hurst exponent.
- Signal - data set (supply and demand and/or total volume) to be used for generation of the trade signal.
- Reverse - enable/disable the diagram calculation mode in terms of limit orders.
- ExcessValidate - the mode of tracking subsequent chains of signals, this option works as a filter.
- ElasticityValidate - check the elasticity of supply/demand to the price, with selection of the position opening type; the option acts as an additional filter.
- Profile - calculation mode of volume profile: normal profile, difference profile and profile of open interest, mathematically obtained by successively zeroing the mutually exclusive volumes.
- Timing - diagram recalculation frequency.
- Volumes – type of volumes, tick or real if provided by the broker.
- TfShift – shift of the applied period.
- Correlation - enable/disable the mode of checking the correlation between the trade signals of the current and the higher timeframes.
- LowLevelValue – below this value the volume is considered as low, in percent.
- LowestLevelValue – below this value the volume is considered as very low, in percent.
- HighLevelValue - above this value the volume is considered as high, in percent.
- HighestLevelValue - above this value the volume is considered as very high, in percent.
- PeriodForXX – an arbitrary period for a specific timeframe.
- DurationParts – the number of the diagram sectors along the time scale.
- StandardDeviations - multiplier for the standard deviation mode.
- HurstExponent - Hurst exponent to calculate the deviation.
- ProfileMaxLengthPix - limit on the profile length in pixels.
- LeftShiftPix – shift of the diagram to the left, in pixels.
- WidthPix – width of the diagram, in pixels.
- FontSize – font size.
The remaining inputs refer to line color and width settings, and their purpose is clear from their names.
Indicator operation features
The presence of a "Buy point" / "Sell point" is expressed by a text message, and also accompanied by a flashing of the relevant price tag. only these two combinations together should be perceived as a valid presence of the signal.
The full recalculation of the diagram is performed according to the Timing variable, a signal is checked on every tick.
A line with a width of zero is not displayed and is not considered in the formation of signals.
You can scroll the chart and view its historic diagram and signals.
alerts and trading tips are given for the periods ranging from current and higher.
The volumes on the diagram are cumulative and normalized to the percentage calculation.


 nload="if(window.viewGallery_GalleryManager) viewGallery_GalleryManager.ImageonLoad(this,7);" />
 nload="if(window.viewGallery_GalleryManager) viewGallery_GalleryManager.ImageonLoad(this,8);" />
 nload="if(window.viewGallery_GalleryManager) viewGallery_GalleryManager.ImageonLoad(this,9);" />
 nload="if(window.viewGallery_GalleryManager) viewGallery_GalleryManager.ImageonLoad(this,10);" />
 nload="if(window.viewGallery_GalleryManager) viewGallery_GalleryManager.ImageonLoad(this,11);" />
本店最新上架
-
- MT4 MT5跟单EA 本地跟单远程跟单 绝不

- ¥1100.00
-
- 在MetaTrader市场购买MetaTrader 5的&#

- ¥3988.00
-
- 在MetaTrader市场购买MetaTrader 5的&#

- ¥3988.00
-
- 在MetaTrader市场购买MetaTrader 5的&#

- ¥3988.00
-
- 在MetaTrader市场购买MetaTrader 5的&#

- ¥3988.00
全网为您推荐
-
- AlgoTradeSoft

- ¥3988.00
-
- 国际期货套利软件

- ¥3988.00
-
- MT4 MT5跟单EA 本地跟单远程跟单 绝不
- ¥1100.00
-
- 在MetaTrader市场购买MetaTrader 5的&#
- ¥3988.00
-
- 在MetaTrader市场购买MetaTrader 5的&#
- ¥3988.00


