Zone of The Price MT4
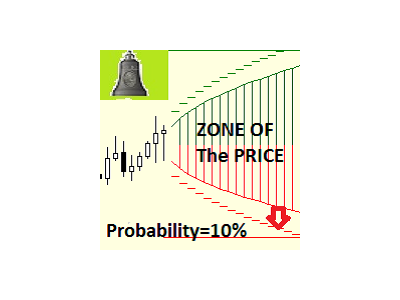
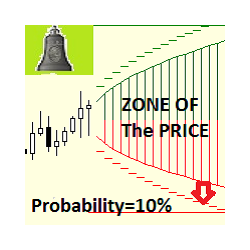
The script plots an area, which has the specified probability of containing the price during the specified time interval. This important information will help in planning trade operations, set the price movement targets and determine the levels for closing positions.
The script plots an area, where the Close price will be located in future with the specified probability. It also calculates the levels that can be reached with the specified probability for each moment of time. The average price value expected at the end of the period is displayed on the chart. In addition, users can set two levels (below and above the current price), for which the script calculates the probabilities of the following events:
- event 1: price reaches the upper level, without falling to the lower level by that moment of time;
- event 2: price reaches the lower level, without raising to the upper level by that moment of time;
- event 3: during the specified time interval, the price reaches neither of the two levels and will remain strictly between them the entire time;
- event 4: price reaches the upper level, regardless of whether the lower level had been reached before;
- event 5: price reaches the lower level, regardless of whether the upper level had been reached before.
The first three events cover all possible scenarios of price movement, that is, comprises a set of collectively exhaustive events.
Knowledge of these probabilities will help when setting the stop loss and take profit levels, as well as limit orders. If there is a long position open, the upper level can be treated as take profit and the lower one as stop loss. For a short position - inversely.
The calculation method is based on the Black–Scholes model, which assumes a random character of the movement and the log-normal distribution of instrument price increments. The model considers the trend, the volatility of the instrument and duration of the time interval for which the probability estimations are performed.
Calculations are based on the equations used in the work: Antoon Pelsser. Pricing Double Barrier Options: An Analytical Approach. January 15, 1997. ABN-Amro Bank Structured Products Group (AA 4410).
Input parameters
- Period (bars) - the number of bars until the end of the prediction period
- Probability of Close - probability for the close price
- Touch Probability - probability of reaching a level (touch)
- high level(points) - the number of points to the upper level from the current price
- low level(points) - the number of points to the lower level from the current price
- distance to the comment from the left - the distance from the left edge of the screen to the comment, in pixels
- distance to the comment from the top - the distance from the top edge of the screen to the comment, in pixels
Instructions
According to the results of calculations, the following items are displayed on the chart:
- vertical line defines the end of the time interval, for which calculation is performed
- upper green and lower red dashed lines indicate the levels, for which the probability of reaching (touching) is equal to the value of Touch Probability specified in the initial conditions
- a tick with the Average label marks the expected average price value at the end of the interval
- solid lines limit the area, where the close price will be located with the probability specified in Probability of Close
- a comment is displayed at the top right corner of the chart, which enumerates the events and their probabilities.
If the mark of the average expected price (Average) is above the current price, then an uptrend is expected, otherwise - downtrend. If the mark is near to the current price, then a flat is expected. The further the level from the current price, the lower the probability of reaching it. This probability also depends on the volatility of the instrument and duration of the period, for which the prediction is performed. The higher the volatility and the longer the period, the higher the probability of reaching a level.
The prediction period is limited to the interval from 3 to 120 hours.
If the calculation comment does not fit the screen, change the distance from the left edge to the comment (the 'distance to the comment from the left' parameter). The 'distance to the comment from the top' can be used to shift the comment down.
Developer: https://www.mql5.com/en/users/komov
本店最新上架
-
- MT4 MT5跟单EA 本地跟单远程跟单 绝不

- ¥1100.00
-
- 在MetaTrader市场购买MetaTrader 5的&#
- ¥3988.00
-
- 在MetaTrader市场购买MetaTrader 5的&#
- ¥3988.00
-
- 在MetaTrader市场购买MetaTrader 5的&#
- ¥3988.00
-
- 在MetaTrader市场购买MetaTrader 5的&#

- ¥3988.00
全网为您推荐
-
- AlgoTradeSoft

- ¥3988.00
-
- 国际期货套利软件

- ¥3988.00
-
- MT4 MT5跟单EA 本地跟单远程跟单 绝不

- ¥1100.00
-
- 在MetaTrader市场购买MetaTrader 5的&#

- ¥3988.00
-
- 在MetaTrader市场购买MetaTrader 5的&#

- ¥3988.00
 客服热线:
客服热线:


