Intraday Momentum Index for MT4
The Intraday Momentum Index (IMI) is a technical indicator that combines aspects of Candlestick Analysis with the Relative Strength Index (RSI).
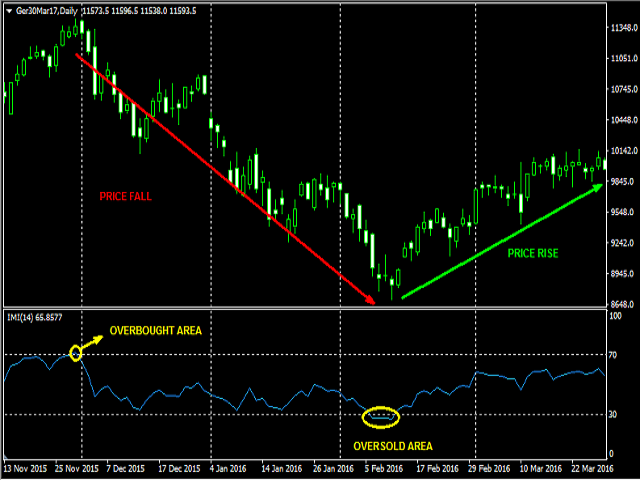
The Intraday Momentum Index indicator concept remains similar to RSI and includes the consideration for intraday open and close prices. The IMI indicator establishes a relationship between a security open and close price over the duration of a trading day, instead of how the open and close prices vary between different days. As it takes into consideration the most recent price variations, it aims to identify overbought and oversold conditions more accurately.
IMI combines some features of the relative strength index, through the relationship between up closes and down closes and whether there is an indication that a security is overbought or oversold, through candlestick charts.
Technical traders can use IMI to anticipate when a security is overbought or oversold. IMI is calculated as follows:
IMI = (Σ up days + Σ down days) * 100
The interpretation and usage of the IMI is that IMI values of 70 or above indicate that a security is becoming overbought or overvalued, and therefore may be primed for a trend reversal or corrective pullback in price. On the other side, an IMI reading of 30 or below is commonly interpreted as indicating an oversold or undervalued condition that may signal a trend change or corrective price reversal to the upside.
Indicator Parameters
- IMI Period - the number of bars used for the indicator calculations.
Trader should look at the IMI over a period of days, with 14 days being the most common period to look at. We also recommend to use it on Daily Time frame (although you can use it on any timeframe that you want)
本店最新上架
-
- MT4 MT5跟单EA 本地跟单远程跟单 绝不

- ¥1100.00
-
- 在MetaTrader市场购买MetaTrader 5的&#
- ¥3988.00
-
- 在MetaTrader市场购买MetaTrader 5的&#
- ¥3988.00
-
- 在MetaTrader市场购买MetaTrader 5的&#
- ¥3988.00
-
- 在MetaTrader市场购买MetaTrader 5的&#

- ¥3988.00
全网为您推荐
-
- AlgoTradeSoft

- ¥3988.00
-
- 国际期货套利软件

- ¥3988.00
-
- MT4 MT5跟单EA 本地跟单远程跟单 绝不

- ¥1100.00
-
- 在MetaTrader市场购买MetaTrader 5的&#

- ¥3988.00
-
- 在MetaTrader市场购买MetaTrader 5的&#

- ¥3988.00
 客服热线:
客服热线:


