 客服热线:
客服热线:


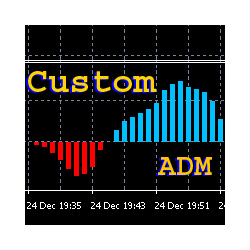


Custom ADM Oscillator
The indicator shows the direction of the current trend based on the calculation of the Average Directional Movement Index, but has two important differences from the standard ADM indicator: it presents the results as a simple and intuitive oscillator, and allows to set a custom sensitivity threshold to cut off the market noise.
The histogram shows the value and sign of the difference between the +DI and -DI lines: on an uptrend the +DI is higher, the difference is positive, and its value is displayed above the zero line by a light blue color. On the contrary, if there is a downtrend, the +DI is lower, the difference is negative and the line corresponding to its value is drawn with red color below the zero line.
To avoid false signals during a flat period or during random short-term price spikes, it is useful to set a specific threshold, below which the indicator's value will remain equal to zero.
As a result, the interpretation of the measurements becomes quite easy: the colored bands of the histogram show the trend direction, and the black "empty" areas depict the flat.
By analyzing the ratio of the extent and the duration of different histogram zones, it is possible to understand what happens on the higher timeframes: for example, if the uptrend zones are longer and the downtrend zones are shorter - then on a higher timeframe there is a stable uptrend.
If the continuous trend lasts very long or ends with a black one - there is a high probability of an extreme.
The indicator has two parameters
- PERIOD - The number of bars, used for the indicator calculation. Recommended values – from 5 to 50.
- THRESHOLD - The indicator sensitivity threshold. Chosen experimentally depending on the market noise value. Usually from 1 to 10.
- MARK - Enable/disable labels on the main chart.
- alert - Enable/disable the alert window.
- MULTI - Enable/disable the calculations for other timeframes.
The screenshot depicts the difference between the proposed and the standard ADM indicator. Both are attached with the same parameter PERIOD = 30.


本店最新上架
-
- MT4 MT5跟单EA 本地跟单远程跟单 绝不

- ¥1100.00
-
- 在MetaTrader市场购买MetaTrader 5的&#

- ¥3988.00
-
- 在MetaTrader市场购买MetaTrader 5的&#

- ¥3988.00
-
- 在MetaTrader市场购买MetaTrader 5的&#

- ¥3988.00
-
- 在MetaTrader市场购买MetaTrader 5的&#

- ¥3988.00
全网为您推荐
-
- AlgoTradeSoft

- ¥3988.00
-
- 国际期货套利软件

- ¥3988.00
-
- MT4 MT5跟单EA 本地跟单远程跟单 绝不
- ¥1100.00
-
- 在MetaTrader市场购买MetaTrader 5的&#
- ¥3988.00
-
- 在MetaTrader市场购买MetaTrader 5的&#
- ¥3988.00


