 客服热线:
客服热线:


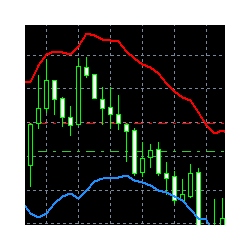


Rsi Channel
This indicator displays the channel of Relative Strength Index.
When you see that the price touches the red line and retreats from it many times, then you will know that the general trend is down.
When it retreats from the blue line many times, that means that the general trend is up.
This lines express the RSI values attributed to the price values on the main chart.
You can add this indicator to your strategy, it will help you.
You will have a chance to enter the market when the price touches the lines but it isn't a strong signal.
This indicator will work best on 5 minutes and higher time frames.
Indicator properties:
- RSI_PERIOD: is the period, on which you want to display the indicator


本店最新上架
-
- MT4 MT5跟单EA 本地跟单远程跟单 绝不

- ¥1100.00
-
- 在MetaTrader市场购买MetaTrader 5的&#

- ¥3988.00
-
- 在MetaTrader市场购买MetaTrader 5的&#

- ¥3988.00
-
- 在MetaTrader市场购买MetaTrader 5的&#

- ¥3988.00
-
- 在MetaTrader市场购买MetaTrader 5的&#

- ¥3988.00
全网为您推荐
-
- AlgoTradeSoft

- ¥3988.00
-
- 国际期货套利软件

- ¥3988.00
-
- MT4 MT5跟单EA 本地跟单远程跟单 绝不
- ¥1100.00
-
- 在MetaTrader市场购买MetaTrader 5的&#
- ¥3988.00
-
- 在MetaTrader市场购买MetaTrader 5的&#
- ¥3988.00


