Spread Analyser
Spread Analyser is a simple but useful indicator which shows and analyses your broker floating-spread history.
Although many brokers claim to have a low spread, they often refer to the time-averaged value, without giving any indications on the maximum value reached during the day. Quite often, the instantaneous spread shows "peaks" that are several times higher than this average. If these peaks take place during high volatility conditions (as happens frequently) then they can dramatically affect your trading strategy.
On the other hand, since spread is the main way brokers protect and achieve their profits, it is likely that the spread behavior could anticipate strong price movements/volatility, or at least provide good entering/exiting market indications.
These are the motivations behind the development of this indicator.
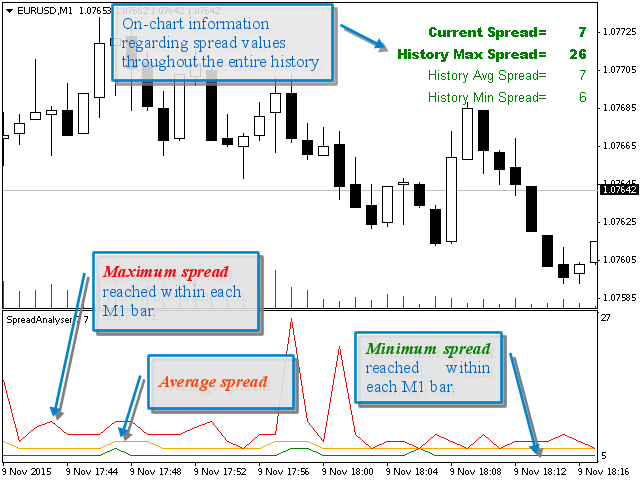
The indicator collects the spread values at each incoming tick and evaluates their maximum, minimum and the average value within each bar and then displays these quantities as lines in its sub-window. At the same time, in the main window of the chart, the same values are reported but referring to the whole history on the chart.
After a few days of collecting data, the trader can thus quite reliably judge the quality of the broker with respect to the important issue of the actual spread level policy. Moreover, he/she can recognize possible correlations with, e.g., the volatility level, volumes, trend strength, etc.
The indicator can be used on any timeframe.
In this (paid) version the spread history can be saved in an external file, so that the collected history data are not lost and can be re-loaded on the chart every time the indicator is re-launched.
Main Parameters
- Past_Bars: the maximum number of past bars at which the indicator displays the spread values when it starts. If no pre-existing history file is found (or if the parameter below is false), then no data is initially displayed and the indicator sub-window is initially empty. In this case, lines will be gradually painted as ticks are received. If Past_Bars=0 then all the available data are put on the chart, up to the oldest bar.
- Spread_History_On_File: if enabled, previously collected data are retrieved from the spread history file and new data will be "appended" on the same file on exit. The file is stored in the "File" directory under the MQL4 sub-directory.
The file name has the form SA_<broker name>_<symbol>_<timeframe>.csv so as to be associated to that particular broker, timeframe and asset.
On Chart Information
- Current Spread = the latest spread measured.
- History Max Spread = the maximum spread detected since the time of the first received value.
- History Avg Spread = the average spread among those detected since the first received value.
- History Min Spread = the minimum spread measured since the first received value.
本店最新上架
-
- MT4 MT5跟单EA 本地跟单远程跟单 绝不

- ¥1100.00
-
- 在MetaTrader市场购买MetaTrader 5的&#
- ¥3988.00
-
- 在MetaTrader市场购买MetaTrader 5的&#
- ¥3988.00
-
- 在MetaTrader市场购买MetaTrader 5的&#

- ¥3988.00
-
- 在MetaTrader市场购买MetaTrader 5的&#

- ¥3988.00
全网为您推荐
-
- AlgoTradeSoft

- ¥3988.00
-
- 国际期货套利软件

- ¥3988.00
-
- MT4 MT5跟单EA 本地跟单远程跟单 绝不

- ¥1100.00
-
- 在MetaTrader市场购买MetaTrader 5的&#

- ¥3988.00
-
- 在MetaTrader市场购买MetaTrader 5的&#

- ¥3988.00
 客服热线:
客服热线:


