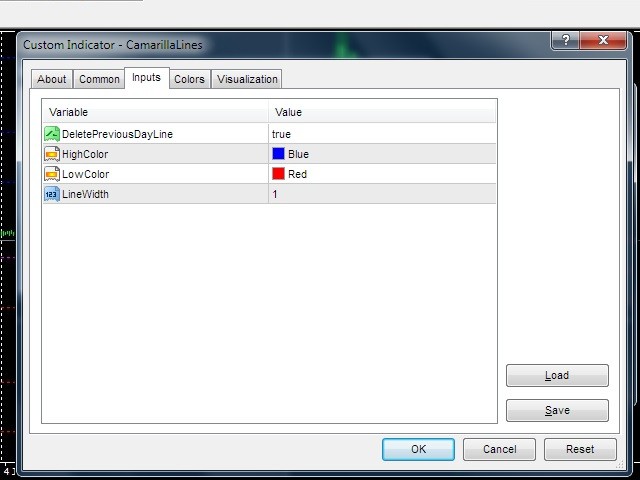
CamarillaLines
A camarilla point is a price level of significance in technical analysis of financial markets that is used by traders as a predictive indicator of market movement. A camarilla point is calculated as an average of significant prices (High, Low and Close) from the performance of a market in the prior trading period. If the market in the following period trades above the camarilla point, it is usually evaluated as a bullish sentiment, whereas trading below the camarilla point is seen as bearish.
Advantages
- Calculate and draw camarilla line in every mode that you need.
- Change lightness ans saturation of lines color.
- Set to draw extend to left or right side.
- Set direct of label to right or left or none.
- define location of label.
- alert, flashing with sound alarm or none, send email and notify when price touch a line or a line break by price.
- Enable highlight a line when mouse is over it.
- Useful indicator data for expert programmer when price break a line.
Input Parameters
- Type of camarilla calculation - camarilla lines usually calculate from yesterday significant prices but you can select one of chart period for it.
- Draw Line from Bar - start draw from this bar and if enter 0 means from max bars and left side of chart.
- Color Of support lines - define a color for support lines.
- Width of support lines - enter 1 to 5 for width of support lines.
- Style of support lines - enter a style (solid, dash, dot, dashdot, dashdotdot) for support lines.
- Draw support lines in Background - draw support lines of indicator in back of chart.
- Color Of resistance lines - define a color for resistance lines.
- Width of resistance lines - enter 1 to 5 for width of resistance lines.
- Style of resistance lines - enter a style (solid, dash, dot, dashdot, dashdotdot) for resistance lines.
- Draw resistance lines in Background - draw resistance lines of indicator in back of chart.
- Extend Lines to right side - draw line and extend all lines to right side of chart.
- Enable flashing when price touch line - set an item for flashing mode when price touch a line.
- Draw end of line in - set an item for location of end of line.
- End of line Position bar number - if you set "DistanceFromCurrentCandle" in "Draw Label in" parameter you can enter a number and end of lines will be drawn at this candle position.
- Enable sound alarm when price touch line - if this parameter set to true when price in candle 0 touch a line, sound will play.
- File name of alarm - this sound play if you enable sound alarm.
- Delay of alarm's sound - delay of alarm's sound in repetition.
- Enable alert when price touch line - if this parameter set to true when price in candle 1 break a line an alert will display.
- Select notify type when price touch line - you can select a notify type when price touch a line.
- Select notify type when price break line - you can select a notify type when price break a line.
- Enable Highlighting line when mouse is over it - if two or more line drop over themselves this item help to you see round line.
- Color of line when it is Highlighting - define a color for highlight mode.
- Style of line when it is Highlighting - define a line style for highlight mode.
- Width of line when it is Highlighting - define width of line for highlight mode.
- Draw line in Back when it is Highlighting - define back drawing mode for highlight mode.
- Indicator ID - if you need to have more than one indicator in a chart, you must define differ ID for every indicator.
Hot Keys
- ' > ' key - increase lightness of indicator objects.
- ' < ' key - decrease lightness of indicator objects.
- ' ? ' key - set lightness to default.
- ' : ' key - increase lightness of indicator objects.
- ' L ' key - decrease lightness of indicator objects.
- ' " ' key - set lightness to default.
- Menu key - show and Hide indicator on chart.
本店最新上架
-
- MT4 MT5跟单EA 本地跟单远程跟单 绝不

- ¥1100.00
-
- 在MetaTrader市场购买MetaTrader 5的&#
- ¥3988.00
-
- 在MetaTrader市场购买MetaTrader 5的&#
- ¥3988.00
-
- 在MetaTrader市场购买MetaTrader 5的&#

- ¥3988.00
-
- 在MetaTrader市场购买MetaTrader 5的&#

- ¥3988.00
全网为您推荐
-
- AlgoTradeSoft

- ¥3988.00
-
- 国际期货套利软件

- ¥3988.00
-
- MT4 MT5跟单EA 本地跟单远程跟单 绝不

- ¥1100.00
-
- 在MetaTrader市场购买MetaTrader 5的&#

- ¥3988.00
-
- 在MetaTrader市场购买MetaTrader 5的&#

- ¥3988.00
 客服热线:
客服热线:


