Multi Timeframe Indicator
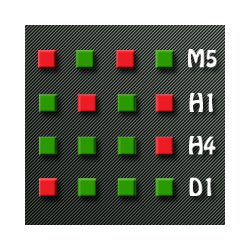
Multi Timeframe Indicator includes a lot of functions and can be considered as a universal helper for a trader. It's main objective is to display up to 10 indicators at a time using just one small brick per each of them. These indicators involve Awesome Oscillator, CCI, DeMarker, MACD, RSI, RVI, Stochastic, Larry Williams' Percent Range, Bulls Power and Bears Power. An important function of the indicator is an ability to monitor signals from different timeframes. You can choose different combinations including either displaying different timeframes of one indicator or several timeframes of various indicators.
The approach of displaying bricks on different timeframes is based on the presence of a signal at the moment of opening a bar of the current timeframe. So you can look through the history and select parameters and a timeframe of each indicator for the best results - the signals will not redraw.. For the sake of convenience, the timeframe you have chosen in display settings is specified in brackets next to the indicator's name on the chart. If you want to use all indicators only on the timeframe of the currently opened chart without using the multitimeframe feature you can select that option as well. You can also change default colors and size of buy and sell bricks, and the color of the indicator name and its timeframe in parameters.
Also it is possible to turn on notifications with various settings.
Indicator Parameters
- First Indicator...Tenth Indicator - select from first to tenth indicator
- First indicator timeframe...Tenth indicator timeframe - select timeframe for each indicator
- Bears Power Period - period of the Bears Power indicator
- Bears Power Applied Price - price used for the Bears Power indicator calculation
- Bulls Power Period - period of the Bulls Power indicator
- Bulls Power Applied Price - price used for the Bulls Power indicator calculation
- CCI Period - period of the CCI indicator
- CCI Applied Price - price used for the CCI indicator calculation
- CCI Level - level of the CCI indicator. A signal appears after crossing this level. This value is entered for the upper level. For the lower level it is automatically calculated as a negative one
- DeMarker Period - period of the DeMarker indicator
- DeMarker Upper Level - upper level of the DeMarker indicator. A sell signal appears after crossing this level
- DeMarker Lower Level - lower level of the DeMarker indicator. A buy signal appears after crossing this level
- MACD Fast EMA Period - fast EMA MACD period
- MACD Slow EMA Period - slow EMA MACD period
- MACD Signal SMA Period - signal SMA MACD period
- MACD Applied Price - price used for the MACD indicator calculation
- RSI Period - period of the RSI indicator
- RSI Applied Price - price used for the RSI indicator calculation
- RSI Upper Level - upper level of the RSI indicator. A sell signal appears after crossing this level
- RSI Lower Level - lower level of the RSI indicator. A buy signal appears after crossing this level
- RVI Period - period of the RVI indicator
- K Period Stochastic - K period of the Stochastic indicator
- D Period Stochastic - D period of the Stochastic indicator
- Slowing Stochastic - averaging period of the Stochastic indicator
- Stochastic Slowing Method - averaging method of the Stochastic indicator
- Stochastic Upper Level - upper level of the Stochastic indicator. A sell signal appears after crossing this level
- Stochastic Lower Level - lower level of the Stochastic indicator. A buy signal appears after crossing this level
- WPR Period - period of Larry Williams' Percent Range
- WPR Upper Level - upper level of Larry Williams' Percent Range. A sell signal appears after crossing this level
- WPR Lower Level - lower level of Larry Williams' Percent Range. A buy signal appears after crossing this level
- Size of the brick - size of a brick displaying a signal
- Color for sell signal bricks - sell signal brick color
- Color for buy signal bricks - buy signal brick color
- Color of indicator label - color of the indicator's name and a timeframe
- Bars to load - number of bars for calculation
- Turn on the alerter - alert when a signal is formed
- Bricks of same color to alert - number of bricks of the same color to give an alert
- Check
for signals on current(running) or previous(closed) bar - monitor signals according to the current (open) bar or the previous (closed) bar
本店最新上架
-
- MT4 MT5跟单EA 本地跟单远程跟单 绝不

- ¥1100.00
-
- 在MetaTrader市场购买MetaTrader 5的&#
- ¥3988.00
-
- 在MetaTrader市场购买MetaTrader 5的&#
- ¥3988.00
-
- 在MetaTrader市场购买MetaTrader 5的&#
- ¥3988.00
-
- 在MetaTrader市场购买MetaTrader 5的&#

- ¥3988.00
全网为您推荐
-
- AlgoTradeSoft

- ¥3988.00
-
- 国际期货套利软件

- ¥3988.00
-
- MT4 MT5跟单EA 本地跟单远程跟单 绝不

- ¥1100.00
-
- 在MetaTrader市场购买MetaTrader 5的&#

- ¥3988.00
-
- 在MetaTrader市场购买MetaTrader 5的&#

- ¥3988.00
 客服热线:
客服热线:


