Secret SnR
The market is very dynamic and we need to think of a dynamic for addressing market that is so random.
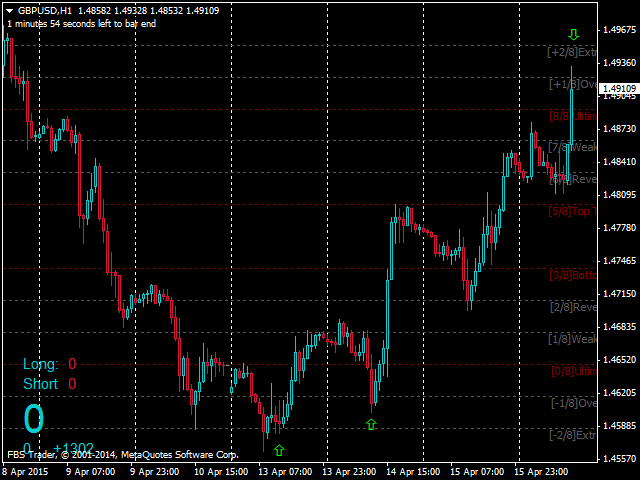
Dynamic Level is the depiction of Support and Resistance based on Time Cycles. The indicator works with Pivot points. It is a trader's assistant in determining support and resistance. This dynamic indicators of levels produces several types of support and resistance levels. One of the indicator lines is meant to show the limits of support and resistance that could be seen from the chart. The line is expected to be able to distinguish between the points of support and resistant point continuously.
The definition of the levels in the Dynamic Level Line:
- 1. Line 8/8/8 0 & (Ultimate Support and Ultimate Resistance). This line can be counted as strongest Support/Resistance.
- 2. Line 7/8 (Weak, the Place to Stop and Reverse). A weak line. If suddenly price moves too fast and too far and then stops here, then the line can be interpreted as the price will soon turn around. If prices do not stop near the line, the price will continue its movement to line 8/8.
- 3. 1/8 Line (Weak, the Place to Stop and Reverse). A weak line. If suddenly price moves too fast and too far and then stops here, then the line can be interpreted as the price will soon turn around. If prices do not stop near the line, then the prices will continue their movement to the 0/8.
- 4. Lines 2/8 and 6/8 (Pivot, Reverse). These two lines to swing a trade with the line 4/8 if the price moves in between the lines 2/8-4/8 or 6/8-4/8.
- 5. Line 5/8 (Top of Trading Range). Price spent 40% of all movement between line 5/8 and 3/8. If the price moves or stops around 5/8 line for 10-12 days, this can be interpreted as a zone to try to grabasell position (there are some people who do this). But if the price moves upward at 5/8, then it can be interpreted that the price will continue to the next resistance level.
- 6. Line 3/8 (Bottom of Trading Range). If the price is below this line and in conditions of an uptrend, it can be interpreted as the price will be very difficult to break this level. If price breaks this level in an uptrend and stays above that level for 10-12 days, then can be interpreted as the price will move between 3/8 and 5/8 for 40% of the time it's movement.
- 7. Line 4/8 (Major Support/Resistance lines). Is a major line of support/resistance. This is good for the entry level, sell or buy. It is strong support when prices are above 4/8 and a strong resistance when the price is below 4/8.
The Trading Range (5/8″ and 3/8) pertama2 may be a little confusing when most of the price movement is outside the lines. But actually these lines are very important for determining the market sentiment. Basically, when the market is between the lines this means market sentiment is flat or sideway. If it is above a line 5/8, the market can be considered bullish, conversely, under 3/8, the market is bearish. The other line is 5/8 is a strong support if we're willing to enter the market which is bullish, and vice versa 3/8 is a strong resistance when we want to enter the market which is bearish.
Breaking of these lines can be very important. For example, if the price is above the 5/8 for some time and then breaks through it downwards, it is a sign that the bullish power starts to run out. Usually always will be followed to the level 4/8, and if that is the case then 5/8 is a significant resistant. If the prices then to level again through 5/8 again, then prices try to re-test a bullish mode again where previously bullish failed.本店最新上架
-
- MT4 MT5跟单EA 本地跟单远程跟单 绝不

- ¥1100.00
-
- 在MetaTrader市场购买MetaTrader 5的&#
- ¥3988.00
-
- 在MetaTrader市场购买MetaTrader 5的&#
- ¥3988.00
-
- 在MetaTrader市场购买MetaTrader 5的&#
- ¥3988.00
-
- 在MetaTrader市场购买MetaTrader 5的&#

- ¥3988.00
全网为您推荐
-
- AlgoTradeSoft

- ¥3988.00
-
- 国际期货套利软件
- ¥3988.00
-
- MT4 MT5跟单EA 本地跟单远程跟单 绝不

- ¥1100.00
-
- 在MetaTrader市场购买MetaTrader 5的&#

- ¥3988.00
-
- 在MetaTrader市场购买MetaTrader 5的&#

- ¥3988.00
 客服热线:
客服热线:


