Trade Levels And Rates
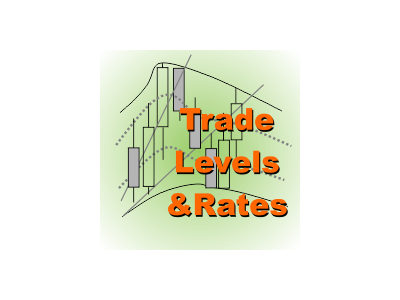
The indicator shows a smooth price channel, potentially profitable and risky zones, as well as price dynamics relative to the interests of the market participants. This allows you to open positions at the best prices and "catch" trends avoiding inefficient and risky trades. Reasonable use of the product together with standard indicators allows you to sort out false signals and create profitable strategies that take into account other traders' behavior.
Structure
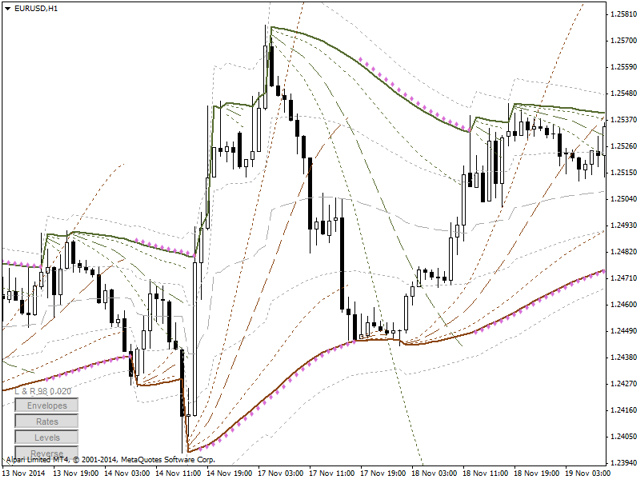
The indicator draws convergent smooth enveloping lines from the extreme price values. Upper and lower enveloping lines form the contracting price channel. Bulls are trying to expand the channel upwards, while bears - downwards. While the price reaches the border of the channel, it shifts the enveloping line for the value depending on the power of the corresponding party. The indicator shows the power of the parties as tempo lines.
The price channel between the enveloping lines is divided downwards by 4 efficiency zones:
- Efficient sells. The price goes up quickly reaching new extreme values. The reversal and downward movement are about to occur. Bearish trends start here, and only SELL trades from resistance levels are possible in that case.
- Risky sells. The price performs less volatile fluctuations along the guiding lines. Therefore, the indicators can be trusted. only SELL trades confirmed by a strong signal are possible
- Risky buys. Similar to zone #2, though the trades are BUY ones.
- Efficient buys. The price goes down quickly reaching new lows. The start of a bullish trend is expected. only BUY trades from support lines are possible.
3 guiding tempos - slow (closest to the enveloping line), medium and fast (more vertical). They also divide the channel by segments.
- fast bear - fast decreasing (bearish) guiding line displays behavior of the bears making fast trades at the best prices and holding positions with the maximum efficiency. As long as the price is below this line, this group does not leave the market keeping positions open.
- slow bear - slow decreasing guiding line displays behavior of the bears holding positions till the risks outweigh the gains.
- medium bear - medium decreasing guiding line displays total bearish tempo
- Similarly, the increasing tempo lines show bullish behavior
Reverse Marker acts like SAR.
Usage
In zone 1:
- buy trades are not allowed, except the case when the upper enveloping line (highlighted by Reverse label) is broken through and the price is higher than "fast bull" line, in other words, when bulls are very strong
- sell when the "fast bull" and "medium bull" lines cross each other. The appropriate groups are leaving the market and the bulls are weakened
- short-term oscillator signals are mostly lagging and providing false data. Do not take them into account
In zone 2:
- sell signal - the first bar is opened below the "fast bull" line, confirmation from another signal is received
If the price is above the "fast bull" line, sell trades are not allowed, except Reverse switch or roll-back from a strong resistance line. Short-term indicator signals should be ignored.
The case is symmetrical for zones 3, 4 and the "fast bear" line.
Generalized Rules
- evaluate the power of bulls and bears using the tempo lines.
- Trade from the zone borders.
- Do not trust indicators when the price is near the enveloping lines.
- Use the slow guiding lines as stop loss levels.
本店最新上架
-
- MT4 MT5跟单EA 本地跟单远程跟单 绝不

- ¥1100.00
-
- 在MetaTrader市场购买MetaTrader 5的&#
- ¥3988.00
-
- 在MetaTrader市场购买MetaTrader 5的&#
- ¥3988.00
-
- 在MetaTrader市场购买MetaTrader 5的&#
- ¥3988.00
-
- 在MetaTrader市场购买MetaTrader 5的&#

- ¥3988.00
全网为您推荐
-
- AlgoTradeSoft

- ¥3988.00
-
- 国际期货套利软件
- ¥3988.00
-
- MT4 MT5跟单EA 本地跟单远程跟单 绝不

- ¥1100.00
-
- 在MetaTrader市场购买MetaTrader 5的&#

- ¥3988.00
-
- 在MetaTrader市场购买MetaTrader 5的&#

- ¥3988.00
 客服热线:
客服热线:


