 客服热线:
客服热线:


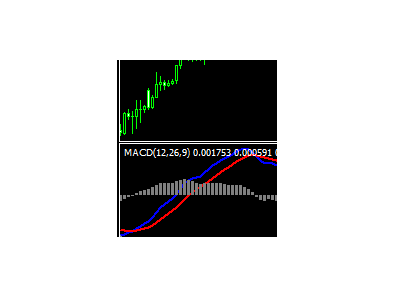


TwoLines MACD
Descriptions
The MACD series proper was invented by Gerald Appel in the 1970s. Thomas Aspray added the divergence bar graph to the MACD in 1986, as a means to anticipate MACD crossovers, an indicator of important moves in the underlying security.
The following R language code computes the three series of the MACD indicator from a given price series "stockPrices":
- MACD = [stockPrices,12]EMA - [stockPrices,26]EMA
- signal = [MACD,9]EMA
- divergence = MACD – signal
Input Parameters
- FastEMA:Fast moving average line, the default period is 12.
- SlowEMA:Slow moving average line, the default period is 26.
- SignalEMA:The average of MACD, the default period is 9.
Trading interpretation
Exponential moving averages highlight recent changes in a stock's price. By comparing EMAs of different lengths, the MACD series gauges changes in the trend of a stock. The difference between the MACD series and its average is claimed to reveal subtle shifts in the strength and direction of a stock's trend. It may be necessary to correlate the signals with the MACD2 indicators like RSI power.
Some traders attribute special significance to the MACD line crossing the signal line, or the MACD line crossing the zero axis. Significance is also attributed to disagreements between the MACD line or the difference line and the stock price (specifically, higher highs or lower lows on the price series that are not matched in the indicator series).
Signal-line crossover
A "signal-line crossover" occurs when the MACD and average lines cross; that is, when the divergence (the bar graph) changes sign. The standard interpretation of such an event is a recommendation to buy if the MACD line crosses up through the average line (a "bullish" crossover), or to sell if it crosses down through the average line (a "bearish" crossover). These events are taken as indications that the trend in the stock is about to accelerate in the direction of the crossover.
Zero crossover
A "zero crossover" event occurs when the MACD series changes sign, that is, the MACD line crosses the horizontal zero axis. This happens when there is no difference between the fast and slow EMAs of the price series. A change from positive to negative MACD is interpreted as "bearish", and from negative to positive as "bullish". Zero crossovers provide evidence of a change in the direction of a trend but less confirmation of its momentum than a signal line crossover.
Divergence
A "positive divergence" or "bullish divergence" occurs when the price makes a new low but the MACD does not confirm with a new low of its own. A "negative divergence" or "bearish divergence" occurs when the price makes a new high but the MACD does not confirm with a new low of its own. A divergence with respect to price may occur on the MACD line and/or the MACD Histogram.[8]
Timing
The MACD is only as useful as the context in which it is applied. An analyst might apply the MACD to a weekly scale before looking at a daily scale, in order to avoid making short term trades against the direction of the intermediate trend.Analysts will also vary the parameters of the MACD to track trends of varying duration. One popular short-term set-up, for example, is the (5,35,5).
False signals
Like any forecasting algorithm, the MACD can generate false signals. A false positive, for example, would be a bullish crossover followed by a sudden decline in a stock. A false negative would be a situation where there was no bullish crossover, yet the stock accelerated suddenly upwards.
A prudent strategy may be to apply a filter to signal line crossovers to ensure that they have held up. An example of a price filter would be to buy if the MACD line breaks above the signal line and then remains above it for three days. As with any filtering strategy, this reduces the probability of false signals but increases the frequency of missed profit.
Analysts use a variety of approaches to filter out false signals and confirm true ones.
A MACD crossover of the signal line indicates that the direction of the acceleration is changing. The MACD line crossing zero suggests that the average velocity is changing direction.


本店最新上架
-
- MT4 MT5跟单EA 本地跟单远程跟单 绝不

- ¥1100.00
-
- 在MetaTrader市场购买MetaTrader 5的&#

- ¥3988.00
-
- 在MetaTrader市场购买MetaTrader 5的&#

- ¥3988.00
-
- 在MetaTrader市场购买MetaTrader 5的&#

- ¥3988.00
-
- 在MetaTrader市场购买MetaTrader 5的&#

- ¥3988.00
全网为您推荐
-
- AlgoTradeSoft

- ¥3988.00
-
- 国际期货套利软件

- ¥3988.00
-
- MT4 MT5跟单EA 本地跟单远程跟单 绝不
- ¥1100.00
-
- 在MetaTrader市场购买MetaTrader 5的&#
- ¥3988.00
-
- 在MetaTrader市场购买MetaTrader 5的&#
- ¥3988.00


