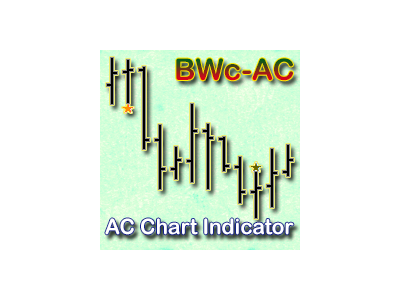
AC Chart Indicator
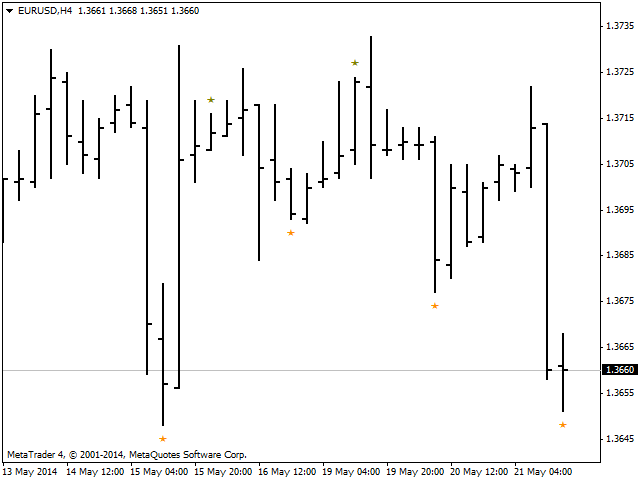
The indicator displays Accelerator Oscillator (AC) signals in accordance with Bill Williams' strategy on a chart.
The AC histogram is a five-period simple moving average drawn on the difference between the value 5/34 of the AO histogram and a 5-period simple moving average of this histogram.
Interpretation of AC is based on the following rules - if AC is above the zero line, it is considered that the market acceleration will continue its upward movement. The same rule applies to the downward movement, if AC is below the zero line. Market growth signals are supported by two green indicator bars (one after the other), when AC is above the zero line. An indication of the falling market is two red bars (one after another) when AC is below the zero line.
Aggressive approach to AC interpretation
When AC is on the opposite side of the zero line (for a long position - below the zero line, and conversely for short positions), an additional bar is required to prove the market movement. As a result, when the AC is below the zero line and you consider the possibility of opening a long position, there should be at least three green bars that appear one after the other below the zero line, and vice versa for short positions.
1. Buy signals occur when:
- the indicator value is above the zero line and it is growing on the current bar and the previous one;
- the indicator value is below the zero line and it is growing on the current bar and two previous ones;
2. Sell signals occur when:
- the indicator value is below the zero line and it is falling on the current bar and the previous one;
- the indicator value is above the zero line and it is falling on the current bar and two previous ones.
本店最新上架
-
- MT4 MT5跟单EA 本地跟单远程跟单 绝不

- ¥1100.00
-
- 在MetaTrader市场购买MetaTrader 5的&#
- ¥3988.00
-
- 在MetaTrader市场购买MetaTrader 5的&#
- ¥3988.00
-
- 在MetaTrader市场购买MetaTrader 5的&#

- ¥3988.00
-
- 在MetaTrader市场购买MetaTrader 5的&#

- ¥3988.00
全网为您推荐
-
- AlgoTradeSoft

- ¥3988.00
-
- 国际期货套利软件

- ¥3988.00
-
- MT4 MT5跟单EA 本地跟单远程跟单 绝不

- ¥1100.00
-
- 在MetaTrader市场购买MetaTrader 5的&#

- ¥3988.00
-
- 在MetaTrader市场购买MetaTrader 5的&#

- ¥3988.00
 客服热线:
客服热线:


