Analyst
Method of trading and technical analysis using an analyst indicator.
In any market, whether it is stocks, minerals (metals, raw materials) or currency pairs, we see a trade window with quotes (price) and trading time. The most important thing for us is to learn to analyze the market and find the entry points, observing all the trading rules, as well as to calculate trade exit points (profit) using only these data: price and time.
The Analyst indicator includes only the price and time data. Doing the math, and studying them on two principles, it compares the two results and determines the market mood at certain periods.
The most important thing in this process was to properly formulate the analysis rules for the analytical structure and the trading part of the system. I'll try to explain briefly how it works.
In real time we have the following:
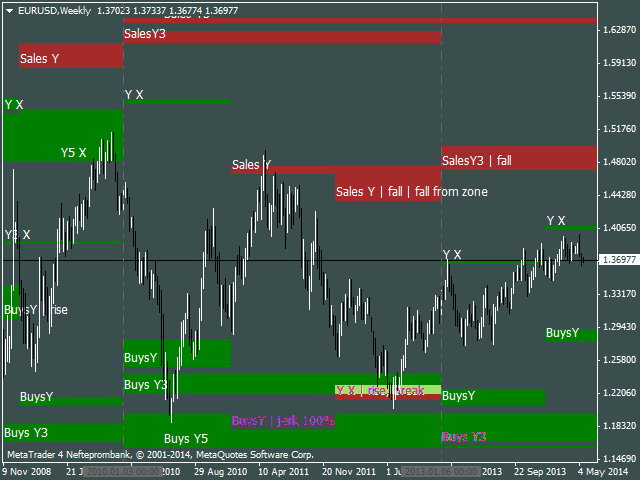
1. When simultaneously using two methods for mathematic calculation of price movement over time, trading zones of several types appear, showing the market mood on a given interval of time.
2. based on the principle (nature), trading zones are divided into several types, which we have tried to describe briefly and clearly for the trading terminal to understand them.
Buy areas are divided into:
- X areas (uncertainty and rising);
- fall down areas;
- growth areas;
- areas of sharp movements.
Sell areas are divided into:
- X areas (uncertainty and falling);
- growth areas;
- fall areas;
- reversal areas.
Brief description of these trade zones in real time greatly helps to select right trades in future. On the chart, you can see that after initiation of zones, they are all different, "thick", "thin", "medium", "high", "low", "wide", "narrow". And each has its own rules, principles and moods. We only need to understand their moods, behavior and their opportunities, of course.
3. Our next task was to define the moods and opportunities of the zones with high probability by using a certain mathematical algorithm in the calculations.
After examining the properties and setting in a certain calculation logic to study the "mood" of the patterns, we have managed to quite accurately describe the market mood and predict its movements. And now it really will help you improve the quality of your trading.
Each of you can backtest all the signals (they are not redrawn), and of all the recommendations of the analyst select only the ones you like the best.
Setting options:
- Timeframe Possible values:
- Y5 - a five-year cycle;
- Y3 - a three-year cycle;
- Y - a year;
- Q - a quarter;
- MN1 - a month;
- W1 - a week;
- D1 - a day;
- H4 - 4 hours;
- H1 - 1 hour.
- Draw lines description - comments to the zones. true - on, false - off.
- Width - the width of timeframe dividing lines, 0 - do not show.
- Style - the style of timeframe dividing lines.
- Color - the color of timeframe dividing lines.
- Zones properties - description of zones:
- M1 Color - color of growth zones,
- M2 Color - color of fall zones,
- М1 under M4 description - a comment for Sell areas (you can add your own comment).
- МS1 under MS4 description - a comment for Buy areas (you can add your own comment).
- М1 above M4 description - a comment for upper X areas (you can add your own comment).
- МS1 above MS4 description - a comment for upper X areas (you can add your own comment).
We continue to improve the analytical features of this indicator. Recommendations of the Analyst indicator will be improved in future versions.
本店最新上架
-
- MT4 MT5跟单EA 本地跟单远程跟单 绝不

- ¥1100.00
-
- 在MetaTrader市场购买MetaTrader 5的&#
- ¥3988.00
-
- 在MetaTrader市场购买MetaTrader 5的&#
- ¥3988.00
-
- 在MetaTrader市场购买MetaTrader 5的&#
- ¥3988.00
-
- 在MetaTrader市场购买MetaTrader 5的&#

- ¥3988.00
全网为您推荐
-
- AlgoTradeSoft

- ¥3988.00
-
- 国际期货套利软件

- ¥3988.00
-
- MT4 MT5跟单EA 本地跟单远程跟单 绝不

- ¥1100.00
-
- 在MetaTrader市场购买MetaTrader 5的&#

- ¥3988.00
-
- 在MetaTrader市场购买MetaTrader 5的&#

- ¥3988.00
 客服热线:
客服热线:


