Gann Fibo Lines
Gann Fibo Lines
Gann technique and fibonacci technique combined.
Introduction
WD Gann was a very intelligent and successful trader. He won many millions with his analysis.
But at his time, there was no computer who can calculate complex algorithm.
So now I have improved the idea from the Gann Angles. The old technique was to find a average price rising per time unit. So we get a trendline with its value. And other trendlines with some simple multiplier (x2 , x4 , x8 and so on)
My Idea was to create a much more exactly value for the trendlines and their price rising. The second idea is to combine this principle with fibonacci ideas. And now the multiplier are not so simple like x2, x4 , x8 and so on.
And the best is, that you do not have to calculate the required average value for any symbol like Gann had to do. It is all automatically.
How to use the Gann-Fibo-Lines
When you are a fan from trend lines or the fibonacci retracements you will like this indicator too.
Like the interpretation from a trendline you can also interpret the Gann-Fibo-Lines. When the price touch the lines, there is a good chance that the price reverse and you have a good canche for profit. Or other interpretation you know from analysis with trend lines.
Description of a Sample
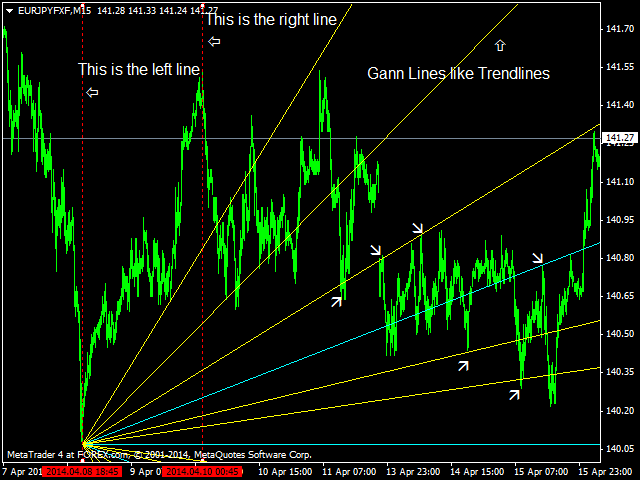
How you can see in the screenshot (first picture), there is a left and a right line. When you place the indicator on the chart, you have to place the left and the right line on a low and on a high from a relevant bar. Relevant bar means a wave from low to high or high to low. Please check that the left line stay left from the right line.
Now the trendlines will be adjust to his correct rising values. And you can see good chances for trading at arrow places.
Input Variables
What you can change in the indicator?
- Level_Mode = 3
- This variable can have values from 1 to 6.
- 1 means very high rising lines
- 6 is the smallest rising value for the lines
- So you can adjust this for your own situation on the chart.
- Bar_Mode = 2
- This variable calculate the average price rising value to create the trendlines.
- It can have values from 1 to 3.
- 1 means less bars from history.
- 3 means most bars from history.
- 1 is better for smaller timeframes like 5M-Chart
- 2 is better for 15M-Chart or 30M-Chart
- 3 is better for 1H-Chart or bigger
- Max_Bars = 20000
- Bars you can place the left line back in the Chart.
For correct calculation you must have enough Bars in the history from the M15-data. (minimum 20 000 Bars).
The best periods for the indicator are 5M, 15M, 30M or 1H. Higher periods are more inexact.
Now I wish you happy trading.
本店最新上架
-
- MT4 MT5跟单EA 本地跟单远程跟单 绝不

- ¥1100.00
-
- 在MetaTrader市场购买MetaTrader 5的&#
- ¥3988.00
-
- 在MetaTrader市场购买MetaTrader 5的&#
- ¥3988.00
-
- 在MetaTrader市场购买MetaTrader 5的&#
- ¥3988.00
-
- 在MetaTrader市场购买MetaTrader 5的&#

- ¥3988.00
全网为您推荐
-
- AlgoTradeSoft
- ¥3988.00
-
- 国际期货套利软件
- ¥3988.00
-
- MT4 MT5跟单EA 本地跟单远程跟单 绝不

- ¥1100.00
-
- 在MetaTrader市场购买MetaTrader 5的&#

- ¥3988.00
-
- 在MetaTrader市场购买MetaTrader 5的&#

- ¥3988.00
 客服热线:
客服热线:


