Pairs Spread
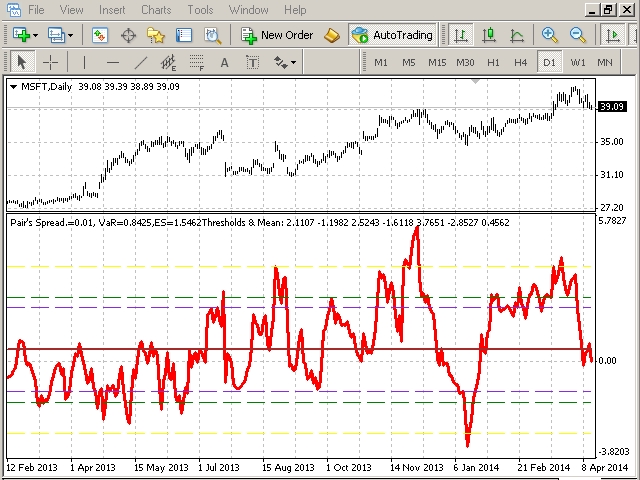
Pair’s Spread Indicator facilitates and makes easier the execution of a very popular speculative investment strategy used in Wall Street called pairs trading. In applying a pairs trading strategy we are not interested in the price of each individual component but in the price difference between them. Pair’s Spread provides exactly this price difference or spread, making your trading decisions much easier. (see input parameters section for more details) Moreover Pair’s Spread Indicator has a Risk Management orientation with its two available Risk Management measures: Value at Risk (VaR) and Expected Shortfall (ES).
- The Value at Risk at a confidence level a=0.95 is given by the smallest number l such that the probability that the loss L exceeds l is no larger than 0.05. By definition a positive value of Value at Risk equal to b means that our position with 95% confidence will not lose more than b.
- Expected Shortfall is closely related to Value at Risk and at a confidence level a=0.95 is the expected loss of our position in the worst 5% of the cases.By definition a positive value of Expected Shortfall equal to b means that in the worst 5% of the possible cases our position will have an expected loss of b.
The presented values of VaR and ES correspond to a position of one unit of the selected pair. Thus to estimate a position’s Value at Risk and Expected Shortfall the presented values should be multiplied by the instrument’s contract size. Moreover the presented Average, VaR and ES values are estimated over the horizon set by the Number_of_Averaging_Lags parameter and NOT over the entire history of the pair (see Input parameters section for a numerical example).
Pair’s Spread can be used also in conjecture with the auxiliary indicators Pair’s MACD, Pair’s RSI and Pair’s Momentum for finding the most profitable timing to open a pair’s trading position.
An alternative use of Pair’s Spread Indicator is for displaying the prices of another instrument in our selected window. For achieving that you should type in Pair A parameter the desired instrument name, in Pair B the name of the instrument already being displayed in our window and in the Mean and Integrating Coefficient parameters 0, ignoring the VaR and ES values. As you can see, following the aforementioned technique, in figure 2 the Pair’s Spread time series in the MSFT window is the same as the time series of INTC in its separate window!
What is Pairs Trading?
This trading strategy looks for pairs of assets that historically have moved together and tries to exploit cases of relative mispricing. More specifically, it assumes that a long-term pricing relationship exists between the two stocks and that the time series of their price spread is stationary. If their spread deviates from its long-term mean by more than a pre-specified threshold, a trader shorts the asset which is overpriced and goes long the relatively underpriced one.
This procedure is referred to as “opening a position”. When the spread converges to its long-term mean the trader unwinds or "closes" his position, making a profit. In case the spread diverges by more than a specific threshold or the spread has not converged before a pre-specified time threshold then the position is closed. It is worth noting that pioneers of this disarmingly simple concept were Nunzio Tartaglia and his team of former academics, who in the mid 80’s by trading such pairs made a $50 million profit, only in their first year (Gatev, Goetzmann, & Rouwenhorst, 2006).
According to Vidyamurthy (2004), there are two types of pairs trading in equity market; statistical arbitrage and risk arbitrage. Statistical arbitrage is based on the idea that two stocks which have similar characteristics and are exposed to similar risks, for example two banks, might be priced more or less the “same”. This does not mean that the two banks should have the same price but that their price spread should have a long-term mean and move within a given band. The greater the divergence from this mean, the greater the profit potential.
On the other hand, risk arbitrage happens in the context of every corporate event that alters the capital structure of a firm. Such examples are tender offers, mergers, exchange offers, spinoffs and recapitalizations. A tender offer is a situation in which a company, the bidder, tries to buy another company, the target. Shareholders of the target firm are offered the opportunity to exchange their shares for cash at a pre-specified price and time. Spinoffs occur when a firm divides its business into separate units. The shareholders of the initial company will receive new stock in the spun-off entity in addition to the shares currently owned by them.
In the merger case, which is the most common, the price ratio and thus the price spread between the two stocks, bidder and target, is locked to a pre-specified level after the completion of the merger. As a result any deviation from this parity relationship gives rise to potential profitable opportunities. However, the completion of a merger is not always a certainty. Thus, the realized price spread corresponds to the market implied probability that the merger will be successful. A risk arbitrage portfolio is created by shorting the bidding stock and buying the target stock. It is worth mentioning that in this case the created portfolio is a market neutral one since after the merger, the two stocks will have the same exposure to the market and thus our portfolio will have a beta of zero.
Input parameters
Lets assume that we have identified a long-term relationship between Microsoft and Intel Corporation. Moreover lets assume that after applying an econometric research we have found that the long-term relationship between Microsoft and Intel is given by the following equation:
MSFT=-13.8362+2*INTC+error
Where the error is normally distributed with mean zero and unit standard deviation.
The above econometric equation uses daily time frame!
Given the above equation the returned Pair’s Spread price is:
P=MSFT-(-13.8362+2*INTC)
- Pair A symbol: Is the symbol of the first pair component. For example MSFT for the Microsoft Corporation. Its value should be a string.
- Pair B symbol: Is the symbol of the second pair component. For example INTC for the Intel Corporation. Its value should be a string.
本店最新上架
-
- MT4 MT5跟单EA 本地跟单远程跟单 绝不

- ¥1100.00
-
- 在MetaTrader市场购买MetaTrader 5的&#
- ¥3988.00
-
- 在MetaTrader市场购买MetaTrader 5的&#
- ¥3988.00
-
- 在MetaTrader市场购买MetaTrader 5的&#

- ¥3988.00
-
- 在MetaTrader市场购买MetaTrader 5的&#

- ¥3988.00
全网为您推荐
-
- AlgoTradeSoft

- ¥3988.00
-
- 国际期货套利软件

- ¥3988.00
-
- MT4 MT5跟单EA 本地跟单远程跟单 绝不

- ¥1100.00
-
- 在MetaTrader市场购买MetaTrader 5的&#

- ¥3988.00
-
- 在MetaTrader市场购买MetaTrader 5的&#

- ¥3988.00
 客服热线:
客服热线:


