EquLevels
Equidistant price and time levels.
Operating Principles:
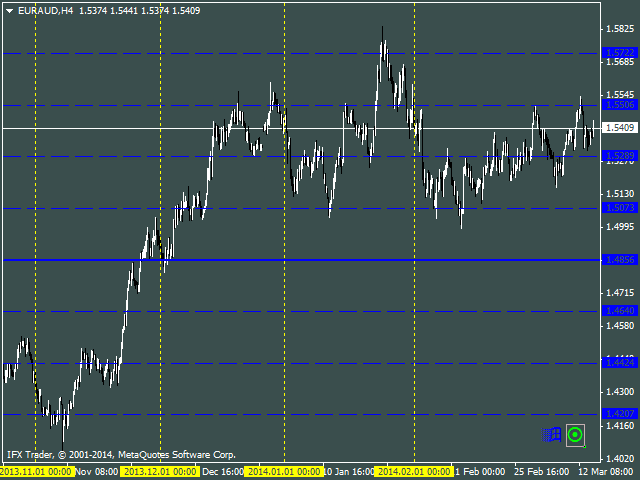
- At the first run, the indicator marks the lines but does not update them thereafter. In order to update the marking, you need to move the green button to any place on the chart. The button is displayed in the bottom right corner of the screen. After moving the button, the indicator will update the marking and switch to passive monitoring mode. Similarly, the marking will not be updated even when you change the time frame until the indicator is manually requested to do so.
- There is a blue button (in the form of the Windows logo) next to the green one. It is used to inform the indicator that the objects should be deleted (i.e. to clear the marking). If you intend to disable the indicator and the marking is no longer needed, simply delete the blue button before the program deinitialization.
Horizontal lines are drawn on the visible part of the chart from the maximum price to the minimum. So the entire price range is always marked on the chart. Vertical lines (date) are plotted from the beginning of the history on the current period or from the specified date.
This indicator can also mark dates in the future.
However, this may present some problems: candlesticks are not regular, i.e. weekends and holidays are skipped and new ticks sometimes do not appear for a long time, which means there will be no bars on lower time frames.
We do not know how the chart will behave in the future (where exactly it will have gaps) and this might affect the accuracy of the marking. So I recommend you to update the marking parameters.
Recommendation: mark the lines on higher time frames and then switch to lower time frames to use the resulting marking in trading.
The DrawOnBackGround parameter allows you to draw lines over or behind the price candlesticks (False/True, respectively).
If you need to use different marking variations at the same time, add several indicators. But in this case, it is very important to set unique HPrefix and VPrefix values for each indicator copy, otherwise they will conflict with each other.
4 Types of Horizontal Lines
- Grid Mode - calculation: 0 - from the lower level; 1 - from the mean level; 2 - from the upper level; 3 - from the specified date;
- Number of Levels - customizable number of lines.
- Style, Color - line style, width, color.
- Prefix - prefix for object names.
- Octaves of a horizontal marking - horizontal marking octaves.
- Select every HNumber line - each HNumber line will be selected.
2 Types of Vertical Lines
- Max date - calculation: 0 - from the beginning of history, 1 - from the specified date.
- Number of levels - customizable number of lines.
- Style, Color, Width - line style, width, color.
- Prefix - prefix for object names.
- Octaves of a vertical marking - vertical marking octaves.
- Select every VNumber line - each VNumber line will be selected.
Seasonal Periods
These periods start on March 20, instead of the beginning of the calendar year. A year is divided into 8 equal parts as well as into thirds, which gives us two more time periods. These time periods are as follows:
- from March 20 through May 5 = 1/8 of the year or 46 days
- June 21 = 1/4 of the year or 91 days
- July 23 = 1/3 of the year or 121 days
- August 5 = 3/8 of the year or 136 days
- September 22 = 1/2 of the year or 182 days
- November 8 = 5/8 of the year or 227 days
- November 22 = 2/3 of the year or 242 days
- December 21 = 3/4 of the year or 273 days
- February 4 = 7/8 of the year or 319 days
- March 20 = 1 year or 365 calendar days
All these periods are important for trend monitoring.
本店最新上架
-
- MT4 MT5跟单EA 本地跟单远程跟单 绝不

- ¥1100.00
-
- 在MetaTrader市场购买MetaTrader 5的&#
- ¥3988.00
-
- 在MetaTrader市场购买MetaTrader 5的&#
- ¥3988.00
-
- 在MetaTrader市场购买MetaTrader 5的&#
- ¥3988.00
-
- 在MetaTrader市场购买MetaTrader 5的&#

- ¥3988.00
全网为您推荐
-
- AlgoTradeSoft

- ¥3988.00
-
- 国际期货套利软件
- ¥3988.00
-
- MT4 MT5跟单EA 本地跟单远程跟单 绝不

- ¥1100.00
-
- 在MetaTrader市场购买MetaTrader 5的&#

- ¥3988.00
-
- 在MetaTrader市场购买MetaTrader 5的&#

- ¥3988.00
 客服热线:
客服热线:


