MACDHistZL
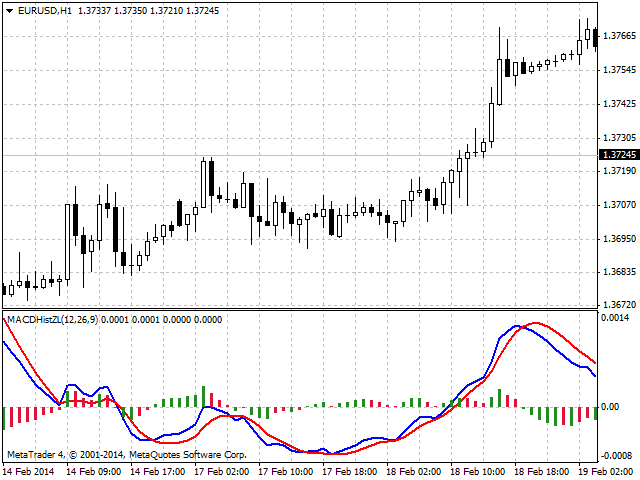
This product is Moving Average Convergence/Divergence Histogram with zero lag. Unlike standard MACD Histogram, MACDHistZL provides signals several bars earlier, while convergences/divergences can be seen more clearly. Green bars indicate that the distance between the fast and slow lines is increasing, while red ones indicate that the distance is decreasing.
A bit of theory:
Most commonly, the indicator is used to detect trading signals during trendless market periods - when the price is stabilizing after an upward or downward movement (consolidation).
- Usually, it is considered that the right moment to buy is when the lesser period moving average (blue line) crosses the greater period moving average (red line) upwards in the lower area.
- The right moment to sell is when the lesser period moving average crosses the greater period moving average downwards in the upper area.
The larger the timeframe, the less the number of false signals. Weekly and daily charts provide good results, while the quality of hourly ones is lower. The relative price volatility is higher on small time scales.
If you always buy when the lesser period moving average crosses the greater period one upwards and sell when the crossing is performed downwards, the results may be bad: after the lesser period moving average crosses the greater period one upwards, the price often retraces in the opposite direction leading to a loss for a position opened at that crossing.
The distance between fast and slow MACD lines changes over time. Those changes provide good additional signals. In order to detect them, we need MACD histogram that is built according to the following simple equation:
MACD histogram = MACD fast line - MACD slow line.
The values obtained by using the equation can be presented as a histogram. When the fast line is above the slow one, the histogram is positive; it is above zero, and its value shows how far (high) the fast line is relative to the slow one. When the fast line is below the slow one, the histogram is negative; its value shows how far (low) the fast line is relative to the slow one.
- Regardless of the histogram's location above or below zero, when the histogram is heading upwards (a previous histogram bar is lower than the next one), the bullish power is increasing generating a buy signal.
- When the histogram is heading downwards (a previous histogram bar is higher than the next one), the bearish power is increasing generating a sell signal.
Divergence is the dissimilarity of the indicator and price chart direction when the higher price maximum is not confirmed by MACD higher maximum (bearish divergence) and the lower minimum of the price is not confirmed by the indicator's one (bullish divergence). Such signals are common to all oscillators.
Generally, divergence means that the trend's strength is diminishing, and a strong correction or reversal is near. The larger the timeframe, the stronger the signal.
本店最新上架
-
- MT4 MT5跟单EA 本地跟单远程跟单 绝不

- ¥1100.00
-
- 在MetaTrader市场购买MetaTrader 5的&#
- ¥3988.00
-
- 在MetaTrader市场购买MetaTrader 5的&#
- ¥3988.00
-
- 在MetaTrader市场购买MetaTrader 5的&#
- ¥3988.00
-
- 在MetaTrader市场购买MetaTrader 5的&#

- ¥3988.00
全网为您推荐
-
- AlgoTradeSoft

- ¥3988.00
-
- 国际期货套利软件

- ¥3988.00
-
- MT4 MT5跟单EA 本地跟单远程跟单 绝不

- ¥1100.00
-
- 在MetaTrader市场购买MetaTrader 5的&#

- ¥3988.00
-
- 在MetaTrader市场购买MetaTrader 5的&#

- ¥3988.00
 客服热线:
客服热线:


