CE oscillator for FME indicator MT4
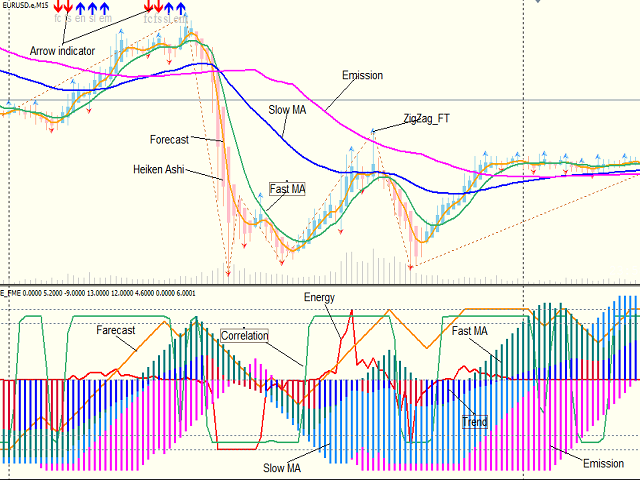
CE oscillator for FME indicator MT4 is a version of the CE oscillator tailored for use together with the Forecast Moving average and Emission MT4 (FME) trend indicator. Input is formed by the FME data alone. Two indicators are brought together as a single trading system using identical settings of the main parameters (see screenshots of the parameter windows).
Additional parameters:
- err - round-off error of the Energy parameter value. It decreases the Energy line "contact noise" when it is near 0.
- ArrowShow - displays arrows indicating actual directions of the indicator lines and server time.
- DrawHistogram - displays Emission trend lines, Slow MA and Fast MA as histograms.
Graphical plots are done in the form of cumulative lines. Such data representation allows for better visualization of reversals and extrema. Cumulative lines smooth out insignificant fluctuations. Continuation of a line on the upper or lower limit of its range suggests that the trend continues in the corresponding direction.
The CE oscillator for FME MT4 uses graphical plots calculated as cumulative values of the following parameters:
- FcLine - difference between the forecast price and emission;
- FsLine - fast MA;
- SlLine - slow MA;
- EmLine - emission line;
Correlation plot is a correlation coefficient of the mean of difference buffers of Forecast-Emisssion, Forecast-Slow MA and Slow-Emisssion.
Trend plot is calculated as a normalized weighted mean of buffers of all cumulative lines.
Energy plot is represented by the energy line which is calculated by the kinetic energy formula used in physics: E = (m*v^2)/2/, where m is tick volumes; v is price rate of change (ROC).
Since the FME trend indicator data serve as input data for the CE oscillator, it is best to set the FME indicator in the main chart window with the same parameters as those used in CE. Thus, we will have a harmonized trading system made up of the trend indicator + oscillator (see the chart screenshot). The Heiken Ashi indicator is included in the built-in indicators, while ZigZag_FT is freely available on the Market.
本店最新上架
-
- MT4 MT5跟单EA 本地跟单远程跟单 绝不

- ¥1100.00
-
- 在MetaTrader市场购买MetaTrader 5的&#
- ¥3988.00
-
- 在MetaTrader市场购买MetaTrader 5的&#
- ¥3988.00
-
- 在MetaTrader市场购买MetaTrader 5的&#
- ¥3988.00
-
- 在MetaTrader市场购买MetaTrader 5的&#

- ¥3988.00
全网为您推荐
-
- AlgoTradeSoft

- ¥3988.00
-
- 国际期货套利软件

- ¥3988.00
-
- MT4 MT5跟单EA 本地跟单远程跟单 绝不

- ¥1100.00
-
- 在MetaTrader市场购买MetaTrader 5的&#

- ¥3988.00
-
- 在MetaTrader市场购买MetaTrader 5的&#

- ¥3988.00
 客服热线:
客服热线:


