Smart ZigZag
Smart ZigZag indicator is a ZigZag, for which the market is actually not accidental. This is not mere words, as this can be confirmed by displayed charts comparing Smart ZigZag and HZZ parameters.
But before I describe the screenshots, let's examine a few details concerning Smart ZigZag. This indicator analyzes the chart and identifies certain activity horizons assigning numbers to them. This can be called ranking. For example, M1 EURUSD chart from 4.01.1999 to 3.12.2013 has the average segment amplitude of 31.08 points (76 982 segments) for rank 2, 65.98 (17 298) - for rank 3, 141.90 (3 959) - for rank 4, 305.25 (868) - for rank 5, 690.74 (174) - for rank 6, 1 618.51 (32) - for rank 7. Any further calculations do not have much sense.
Displayed rank is set in the indicator parameters. Apart from ZigZag itself, a range with the boundaries defining the switching of Smart ZigZag current segment's direction is displayed on the chart. These levels can be used, for instance, for placing pending orders or Stop Loss either manually, or using Expert Advisors.
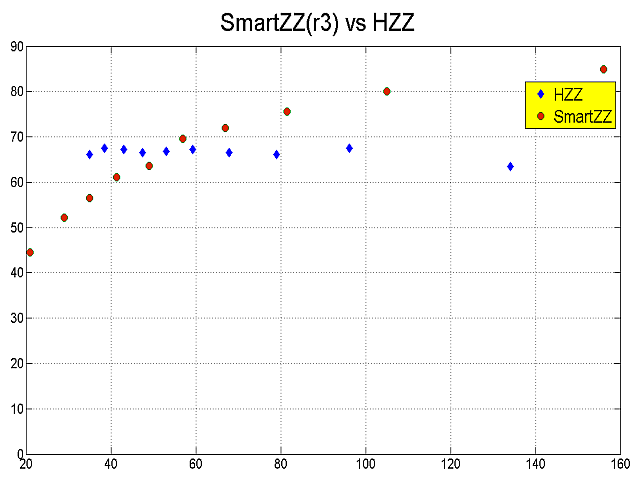
Now, let's pass to the charts. These are dependencies of the ZigZag segment's average amplitude from the previous segment for rank 3 (SmartZZ(r3) vs HZZ) and 4 (SmartZZ(r4) vs HZZ). Thus, this is "just" a parameter of the indicators' predictive power. The axes represent the amplitudes in four digits. HZZ switching parameters is selected so that the average amplitude of its segments is almost equal to SmartZZ segments' average amplitude.
about 2 000 segments for r3 and about 400 ones for r4 are "built" in each chart point. It turns out that the points are located almost horizontally for HZZ. It means that there is virtually no long-term dependency between the amplitudes of the two consecutive segments. It does not mean that HZZ is bad ZigZag, as the market has changed its mood many times in the last 14 years. I think there are few indicators having "predictions" different from 50/50 in such a sampling. However, please note that SmartZZ indicator represents exactly that case, as we can see the quite noticeable dependency of the following segment from the previous one's amplitude.
We should understand that this is a statistical relationship. This dependency can be called strong only by the market standards (we should be aware that the market's "objective" is to destroy any causal relationship, i.e., the market always strives for "efficiency"). Thus, when following this dependency, you will have both favorable and unfavorable periods, though the former ones will prevail. However, unfavorable periods will increase the drawdown, so you will have to trade in quite small lots. This would greatly reduce your relative gain.
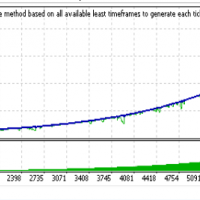
In other words, such profitability (considering remaining risks that are inevitable) will hardly suit you. However, SmartZZ will provide you with good primary signals for further filtration. The "only" thing you will have to learn to do is use favorable periods and avoid unfavorable ones. The test results of the one of Expert Advisors based on the filtration of SmartZZ signals can also be found in the attached screenshots (summer 2004 - December 2013, stable lot).
Besides, the charts show that maximum amplitudes of SmartZZ are markedly higher than HZZ ones (while the average values are equal, as you remember). It means that SmartZZ will be significantly more efficient in case of trailing stop.
SmartZZ calculates some statistical parameters on the fly, displays them as comments and also allows writing the coordinates of the extreme values to file.
SmartZZ parameters:
- ShowRank sets displayed rank.
- HistoryDepth sets the depth of the calculated history in bars. 0 means calculation along the entire available history. -1 means calculation on the specified interval. Despite such remarkable characteristics, SmartZZ is a very fast indicator, which means you can use 0 in most cases.
- StartDate sets calculation start time (in case HistoryDepth = -1).
- StopDate sets calculation end time (in case HistoryDepth = -1).
- SaveData manages writing the coordinates of the extreme values to file.
本店最新上架
-
- MT4 MT5跟单EA 本地跟单远程跟单 绝不

- ¥1100.00
-
- 在MetaTrader市场购买MetaTrader 5的&#
- ¥3988.00
-
- 在MetaTrader市场购买MetaTrader 5的&#
- ¥3988.00
-
- 在MetaTrader市场购买MetaTrader 5的&#
- ¥3988.00
-
- 在MetaTrader市场购买MetaTrader 5的&#

- ¥3988.00
全网为您推荐
-
- AlgoTradeSoft

- ¥3988.00
-
- 国际期货套利软件

- ¥3988.00
-
- MT4 MT5跟单EA 本地跟单远程跟单 绝不

- ¥1100.00
-
- 在MetaTrader市场购买MetaTrader 5的&#

- ¥3988.00
-
- 在MetaTrader市场购买MetaTrader 5的&#

- ¥3988.00
 客服热线:
客服热线:


