NewADX
What is ADX?
ADX (Average Directional Movement Index). This indicator was developed by J. Welles Wilder.
It serves as an indicator of directional movement (i.e. trend) strength. The calculation of directional movement index (DMI) is based on the assumption that where there is an uptrend, today's high should be higher than yesterday's high. Conversely, where there is a downtrend, today's low should be lower than yesterday's low.
Using the ADX
ADX is often neglected due to its obvious disadvantage associated with the lack of correlation with price movements. It is extremely important to clearly understand that ADX itself does not indicate the market direction. The ADX indicator might be falling when prices are going up and growing when they are falling. It is intended to measure trend strength, instead of its direction.
A growing ADX indicates a strong trend and suggests using trend-following trading strategies. Technical indicators that need strong trends to yield big profits, such as moving average crossovers and breakout methods should in this case work very well. A falling ADX suggests a non-trend market that requires a counter-trend strategy, rather than trend-following methods.
Using the DMI
Since the calculation of ADX is based on the DMI (Directional Movement Index) data, both of them are often used as the single ADX indicator. DMI is represented by two lines: +DI (positive directional indicator) and -DI (negative directional indicator). A crossover of these two lines suggests either a potential change in trend or a starting correction. A situation where the +DI is above the -DI suggests that an uptrend is currently prevailing. When the -DI is above the +DI, we have a prevailing downtrend.
Combination of ADX and DMI
If the +DI is above the -DI, while ADX is rising, it may safely be said that the uptrend is gaining momentum.
If the -DI is above the +DI, while ADX is rising, it may safely be said that the downtrend is gaining momentum.
If the +DI is above the -DI, while ADX is falling, it suggests that the uptrend is losing momentum (i.e. the uptrend is becoming a sideways trend). The trend may further continue or change direction to its opposite.
If the -DI is above the +DI, while ADX is falling, it suggests that the downtrend is losing momentum (i.e. the downtrend is becoming a sideways trend). The trend may further continue or change direction to its opposite.
The NewADX Indicator
NewADX derives from the ADX indicator. In other words, this indicator is intended for indicating strength and direction of the current trend. However, it has a number of advantages over the standard ADX indicator:
- Smoothness.
- Fewer false signals.
- The minimum lag (1 bar) between the crossover of the DMI lines and the ADX growth start.
- It has its own overbought level. When this level is hit or crossed by the DMI lines or ADX, we can soon expect the trend to slow down or change to the opposite.
NewADX Indicator Parameters
The indicator has one input parameter, ADX_Period, that is used to specify the period on which the indicator values are calculated.
NewADX Indicator Lines
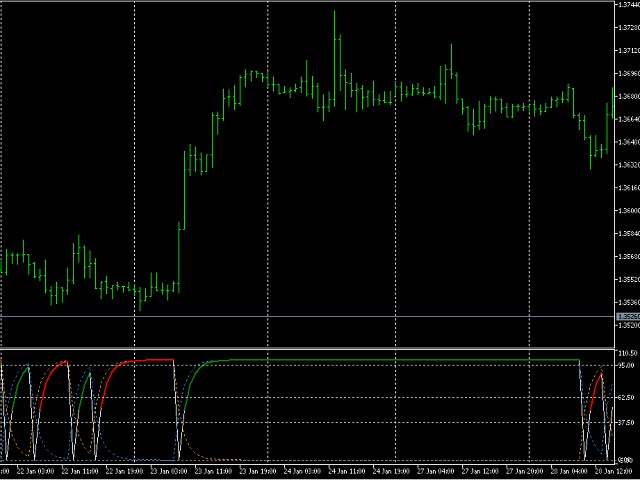
- NewADX - AliceBlue. It corresponds to the ADX line and suggests that the trend is currently losing momentum.
- +NewDI - DodgerBlue. This line corresponds to the +DI.
- -NewDI - Orange. This line corresponds to the -DI.
- NewADXcolorGreen - Green. It corresponds to the ADX line and suggests that the uptrend is currently gaining momentum.
- NewADXcolorRed - Red. It corresponds to the ADX line and indicates that the downtrend is currently gaining momentum.
本店最新上架
-
- MT4 MT5跟单EA 本地跟单远程跟单 绝不

- ¥1100.00
-
- 在MetaTrader市场购买MetaTrader 5的&#
- ¥3988.00
-
- 在MetaTrader市场购买MetaTrader 5的&#
- ¥3988.00
-
- 在MetaTrader市场购买MetaTrader 5的&#
- ¥3988.00
-
- 在MetaTrader市场购买MetaTrader 5的&#

- ¥3988.00
全网为您推荐
-
- AlgoTradeSoft

- ¥3988.00
-
- 国际期货套利软件

- ¥3988.00
-
- MT4 MT5跟单EA 本地跟单远程跟单 绝不

- ¥1100.00
-
- 在MetaTrader市场购买MetaTrader 5的&#

- ¥3988.00
-
- 在MetaTrader市场购买MetaTrader 5的&#

- ¥3988.00
 客服热线:
客服热线:


