 客服热线:
客服热线:


TickChart Indicator for MT5
TickChart Indicator plots tick line on the main window of metaTrader.
( Free version of this is "TickChart Indicator Lite" )
The tick-line shows the most detailed, fastest and real-time activities of the market, which are usually hidden in bars or candles longer than 1 minute. Usually, several new tick-line segments appear while a bar of M1 time frame is completed. After the release of an important economic indicator, the number of ticks per bar may exceeds 100.
This indicator overlays the tick-line on normal chars in the main windows. Although usual charts are in "time-price" space, the tick-chart is in "tick-price" space, that is, the X-axis of tick chart is not the time. When market is very active, the X-axis of tick-chart advances fast and vice versa.
TickChart indicator can be useful is many situations. For example,
- A tool for scalping : You can find several chances in a minute
- Find chances in the turbulence after the release of importance economic indicators: The tick-chart shows the detailed price changes hidden in a long long bull/bear candle
- As an electro-cardiogram of market: The pace of tick-chart segments generation indicates how vital the market is
- Multi-time-frame market watch: For example, you can see the tick chart and M15 time frame chart on the same window. This indicator overlays the shortest time frame, the tick.
- alert of significant price changes: Send an email and/or notifications using RSI and Envelope deviation.
There may be more usages. If you find a nice one, please let me know.
Inputs
| Parameter name | Description |
|---|---|
| Number of ticks to draw | It is about 200. Too many ticks may slows down metaTrader |
| Tick-bid-line width | Width of the tick-line for bid price. Width 0 indicates no tick-bid-line |
| Tick-bid-line color (MT5) | Line color |
| Tick-bid-line style (MT5) | Line style, solid, dots, ... |
| Tick-ask-line width | Width of the tick-line for ask price. Width 0 indicates no tick-ask-line |
| Tick-ask-line color (MT5) | Line color |
| Tick-ask-line style (MT5) | Line style, solid, dots, ... |
| Tick-MA period | Period of SMA, i.e. how many ticks will be used to calculate the moving average |
| Tick-MA bid line width | Line width of tick SMA on bid price. Width 0 indicates no SMA line |
| Tick-MA bid line style (MT5) | Line style |
| Tick-MA bid line color (MT5) | Line color |
| Tick-MA ask line width | Line width of tick SMA on ask price. Width 0 indicates no SMA line |
| Tick-MA ask line style (MT5) | Line style |
| Tick-Ma ask line color (MT5) | Line color |
| alert email | Turn on/off email
alert. alert occurs when RSI and Envelope provides the same buy/sell signal described below.
If "true", alert will be send when ( (RSI<RSI_lower_level) or (RSI>RSI_upper_level) ) and ( (deviation>alert_level) or (deviation< -alert_level) ) |
| alert notify | Turn on/off notification (using metaQuotesID in metaTrader option). The same alert as above. |
| Envelope period for alert | Envelope period of alert. The period here is the number of bars, not the number of ticks. |
| RSI period for alert | RSI period of alert, The number of bars. |
| RSI lower alert level | RSI less than this value indicates that the price is near the buy area |
| RSI upper alert level | RSI higher than this value indicates that the price is near the sell area |
| Envelope deviation alert level | Envelope deviation higher/lower than (level)/(-level) indicates the price is near the sell/buy area |
| Minimum alert interval | Do not send alert for this specified interval after the previous alert for avoiding too many alerts in a same incident |
(MT5): only in the metaTrader5 version. In metaTrader4 version, line properties are in the property of indicator.
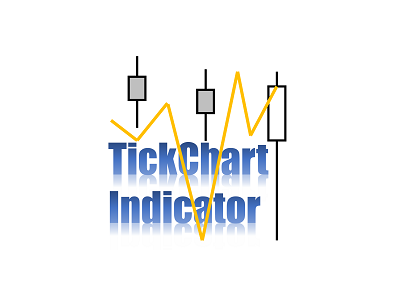
Screenshot
The screenshot show the two tick lines of bid and ask prices and the 20MA tick line. It shows that the detailed price changes inside long candles. The high price (p) of a candle is displayed as the peak of tick chart (p'). You can see many highs and lows inside a candle and find more trade chances.

本店最新上架
-
- MT4 MT5跟单EA 本地跟单远程跟单 绝不

- ¥1100.00
-
- 在MetaTrader市场购买MetaTrader 5的&#

- ¥3988.00
-
- 在MetaTrader市场购买MetaTrader 5的&#

- ¥3988.00
-
- 在MetaTrader市场购买MetaTrader 5的&#

- ¥3988.00
-
- 在MetaTrader市场购买MetaTrader 5的&#

- ¥3988.00
全网为您推荐
-
- AlgoTradeSoft

- ¥3988.00
-
- 国际期货套利软件

- ¥3988.00
-
- MT4 MT5跟单EA 本地跟单远程跟单 绝不
- ¥1100.00
-
- 在MetaTrader市场购买MetaTrader 5的&#
- ¥3988.00
-
- 在MetaTrader市场购买MetaTrader 5的&#
- ¥3988.00


