 客服热线:
客服热线:


MACD Cross Prediction Indicator
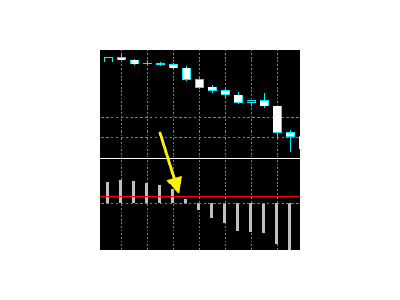
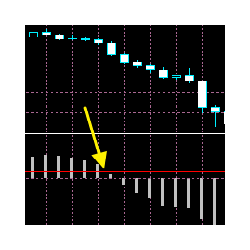
The moment when the MACD line crosses the signal line often leads to a significant price movement and trend changes.
MACD Cross Prediction is an indicator that uses OSMA(MACD oscillator) and a red line. You can change the level of the red line on the indicator setting popup(and the red line moves up and down). The alerts(email, mobile push, sound, MT5 alert) will be sent when the MACD histogram touches the red line, which means the alerts can be sent just before/around the time when the MACD line crosses the signal line.
This indicator works for all pairs including Gold and Oil etc.....
----------------------------------------------------------------------------------------------
What is MACD(OSMA)?
MACD, short for moving average convergence/divergence, is a trading indicator used in technical analysis of stock prices, created by Gerald Appel in the late 1970s.[1] It is designed to reveal changes in the strength, direction, momentum, and duration of a trend in a stock's price.
The MACD indicator (or "oscillator") is a collection of three time series calculated from historical price data, most often the closing price. These three series are: the MACD series proper, the "signal" or "average" series, and the "divergence" series which is the difference between the two. The MACD series is the difference between a "fast" (short period) exponential moving average (EMA), and a "slow" (longer period) EMA of the price series. The average series is an EMA of the MACD series itself.
Signal-line crossover
A "signal-line crossover" occurs when the MACD and average lines cross; that is, when the divergence (the bar graph) changes sign. The standard interpretation of such an event is a recommendation to buy if the MACD line crosses up through the average line (a "bullish" crossover), or to sell if it crosses down through the average line (a "bearish" crossover).[6] These events are taken as indications that the trend in the stock is about to accelerate in the direction of the crossover.
OsMA is an abbreviation for the term oscillator of a moving average (MA). The OsMA is a technical indicator that shows the difference between an oscillator and its moving average over a given period of time. The MACD is most common oscillator used in the OsMA indicato
-https://www.investopedia.com/terms/o/osma.asp


本店最新上架
-
- MT4 MT5跟单EA 本地跟单远程跟单 绝不

- ¥1100.00
-
- 在MetaTrader市场购买MetaTrader 5的&#

- ¥3988.00
-
- 在MetaTrader市场购买MetaTrader 5的&#

- ¥3988.00
-
- 在MetaTrader市场购买MetaTrader 5的&#

- ¥3988.00
-
- 在MetaTrader市场购买MetaTrader 5的&#

- ¥3988.00
全网为您推荐
-
- AlgoTradeSoft

- ¥3988.00
-
- 国际期货套利软件

- ¥3988.00
-
- MT4 MT5跟单EA 本地跟单远程跟单 绝不
- ¥1100.00
-
- 在MetaTrader市场购买MetaTrader 5的&#
- ¥3988.00
-
- 在MetaTrader市场购买MetaTrader 5的&#
- ¥3988.00


