 客服热线:
客服热线:


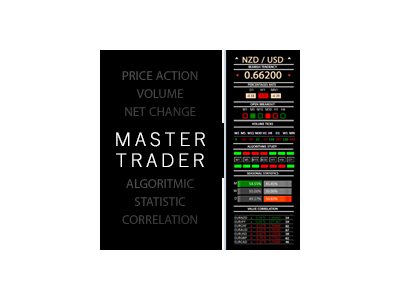


Master Trend Dashboard
Master Trend Dashboard is a new generation indicator, compact, light and efficient.
Each element of this Dashboard is designed to return specific signals as: Price Action, Breakout, Net Change (performance of the instrument), algorithmic studies, correlations and statistical calculations.
This tool will change your way of trading allowing you to receive important information.
See the Graphic Signals to understand every single signal below:
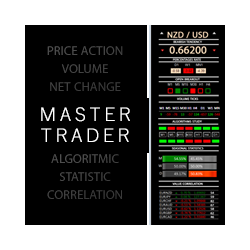
Graphic Signals
- Symbol name and arrow color
- Green = Current Price above previous Daily High
- Red= Current Price under previous Daily Low
- Symbol Price color
- Pink = Price under Daily Open
- Red = price under Daily Low
- Light green = price above Daily Open
- Dark green = price above Daily High
- Bearish/Bullish label (price respect Daily Open)
- Net Change = performance of the instrument in percentage (Daily, Weekly, Monthly, Quarterly, Semi-annual and Annual performances)
- Open Breakout (PA)
- Empty color (indicates if current candle is Bearish/Bullish)
- Full color (indicates the BO of previous High/Low)
- Volume Ticks (measure the range in points for each time frame)
- Algorithms Study
- RSI > 50 = Green or RSI < 50 = Red
- MFI > 50 = Green or MFI < 50 = Red
- Seasonal Statistics = gives you a cyclical temporal analysis (monthly, weekly, daily)
- Value Correlation (extrapolate a percentage ordered for symbols in order to have a real reference on the performance of the instrument, price and Daily PIPS)
- Click on button to filter the symbols
- Symbol Lists to switch Symbol chart (you can change the symbols in EA input)
- every Symbol changes color when the BO of Timeframe candle in input is done
- TF and ZOOM panel (arrows changes TF and ZOOM chart)
How to use Signals
When all graphic signals are in according in color you can take position.
Ex. Symbol label is green, BULLISH label, price is green, most of volumes are green, RSI green and MFI green, statistics are favorable and symbol is powerful (Value Correlation session).
Input Values
- BEST AND WORST SETTINGS
- Time frame to analyze
- Best And Worst FontSize
- RSI SETTINGS (periods)
- MFI SETTINGS (periods)
- BO SETTINGS
- Enable_Signal_BO (to enable signals)
- Colors
- SYMBOLS (MAX 28 symbols or indexes)
- Forex_Suffix_Symbols (add Forex Suffix to NOT show it on button Symbols)
- COLORS SETTING:
- Text_Color
- Panel_Color = Background colors of panel
- Symbol_Panel_Color
- POSITION SETTINGS:
- inX
- inY
Notes: for the correct info of this feature you have to download all historical data.


ta itemprop="image" content="https://c.mql5.com/31/112/master-trend-dashboard-screen-2803.png" />


本店最新上架
-
- MT4 MT5跟单EA 本地跟单远程跟单 绝不

- ¥1100.00
-
- 在MetaTrader市场购买MetaTrader 5的&#

- ¥3988.00
-
- 在MetaTrader市场购买MetaTrader 5的&#

- ¥3988.00
-
- 在MetaTrader市场购买MetaTrader 5的&#

- ¥3988.00
-
- 在MetaTrader市场购买MetaTrader 5的&#

- ¥3988.00
全网为您推荐
-
- AlgoTradeSoft

- ¥3988.00
-
- 国际期货套利软件

- ¥3988.00
-
- MT4 MT5跟单EA 本地跟单远程跟单 绝不
- ¥1100.00
-
- 在MetaTrader市场购买MetaTrader 5的&#
- ¥3988.00
-
- 在MetaTrader市场购买MetaTrader 5的&#
- ¥3988.00


