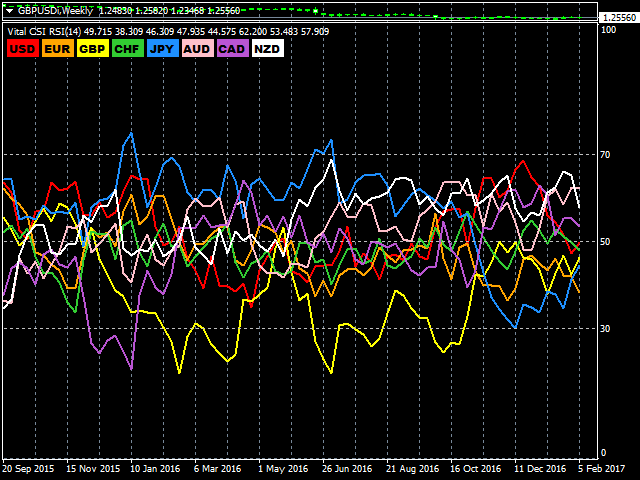
Vital Currency Strength Indicator Pro MT4 Demo
Free Demo
This is a demonstration version of the Vital Currency Strength Indicator Pro. This version of the indicator only operates on the monthly (MN) timeframe.
Purpose
The purpose of this indicator is to evaluate individual currencies’ behavior in many useful ways.
In a given timeframe, the indicator will tell the user whether a certain currency is overbought, oversold, trending up, or trending down, depending on its configuration.
Mechanism
First, the indicator retrieves the needed open, close, high, low, and volume data from up to seven ticker symbols to generate indices for up to eight currencies.
Next, common indicator tools (or “processors”) are used to analyze these index feeds. Each processor is configurable.
- Raw – No processing, outputs close indices.
- RSI Processor – Applies RSI to close indices.
- MACD Processing – Applies MACD to close indices.
- Stochastic Processing – Applies Stochastic to close, high, and low indices.
- CCI Processing – Applies CCI to close, high, and low indices.
- MFI Processing – Applies MFI to close, high, and low indices as well as tick volume data.
- TrendMonitor – Applies TrendMonitor to close data. Here, a currency is trending if the configured moving average is increasing or decreasing. For example, on the daily chart, a user can identify which currencies are trending on the 20 SMA – and in which direction.
Next, the output of any of these processors can be smoothed with a moving average. This can be useful to filter out noise and reduce likelihood of “fake-outs”.
Finally, the user will have some visual controls, in order to both permanently and quickly eliminate distractions. Buttons are provided to hide and show plot lines quickly – alternatively, they can be input as booleans.
Inputs List (abbreviated)
Below is a brief walkthrough of the inputs:
- (A): Processor
- Select main mode of operation.
- This selection will determine which inputs are applicable.
- (B) Moving Average Post-Processing
- Select whether or not to apply moving average smoothing to your data.
- Processor controls
- only the relevant inputs will be used. For example, only the RSI processor will use "Period RSI".
- Post MA Period & Method
- If applicable, this will control the output smoothing.
- Calculate [XXX]
- If enabled, this currency's index will be calculated.
- At least two currencies need to be calculated. (If only two currencies were calculated, the output should be similar to - if not identical to - that of the same pair.)
- If, for example, there is no ticker for NZDUSD, set "Calculate NZD" to false.
- [XXXYYY] Symbol
- Input string names for all tickers.
- Some brokers use eccentric symbols (i.e. EURUSDi, EURUSDecn).
- [XXXYYY] Inception Value
- Initial value used to calculate 10,000-unit long position for each currency in index calculations.
- Default values are for end-of-year 2015.
- Maximum allowable calculations
- Max number of calculations for index bars calculated.
- A higher number offers more precedence but makes the indicator slower.
- A lower number makes the indicator faster but gives less precedence.
- Default is 10,000
- Line colors can be selected.
- Plot widths can be set.
- Stochastic - Full %K Line
- Optionally, the Full %K Line can be shown in stochastic mode.
- This can be useful for Stochastic crossover analysis.
- Three levels can be set for any indicators that range from 0 to 100 (i.e. RSI, Stoch, etc.)
- Additional levels can be set.
- Lines can be displayed or hidden upon initialization.
- Buttons
- Can be on or off.
- Can be arranged vertically or horizontally.
本店最新上架
-
- MT4 MT5跟单EA 本地跟单远程跟单 绝不

- ¥1100.00
-
- 在MetaTrader市场购买MetaTrader 5的&#
- ¥3988.00
-
- 在MetaTrader市场购买MetaTrader 5的&#
- ¥3988.00
-
- 在MetaTrader市场购买MetaTrader 5的&#

- ¥3988.00
-
- 在MetaTrader市场购买MetaTrader 5的&#

- ¥3988.00
全网为您推荐
-
- AlgoTradeSoft

- ¥3988.00
-
- 国际期货套利软件

- ¥3988.00
-
- MT4 MT5跟单EA 本地跟单远程跟单 绝不

- ¥1100.00
-
- 在MetaTrader市场购买MetaTrader 5的&#

- ¥3988.00
-
- 在MetaTrader市场购买MetaTrader 5的&#

- ¥3988.00
 客服热线:
客服热线:


