Statistical Volatility MT4
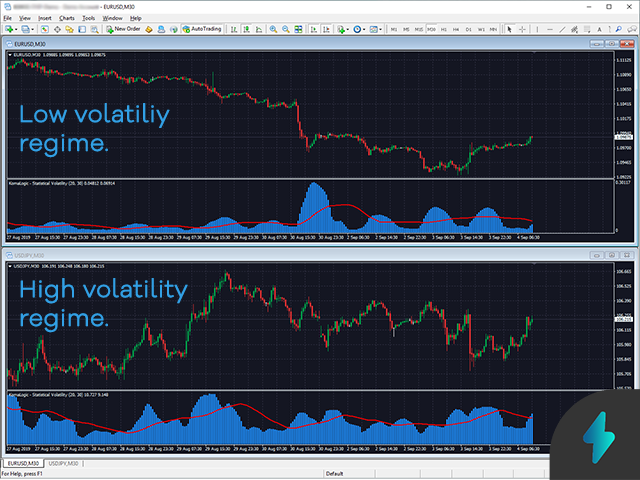
The Statistical Volatility Indicator plots the true Statistical Volatility of an asset's time series as an histogram. It is very easy to interpret even being such a powerful tool. It must be read as the percent (%) value of an asset's volatility over a certain time period in the timeframe the indicator is working with. It also plots the Moving Average of the volatility itself, so you can see at a quick glance if the volatility is above or below its average level.
Volatility is essential for traders to make money. In order to benefit from a trade, you need the price to be moving! And during low volatility regimes this simply doesn't happen strongly enough. Lack of volatility can also cause oversized trades to try to profit from small movements, which involves lots of risk as exposure to sudden and abrupt big movements with huge orders can easily become problematic. That's why not entering the market during low volatility regimes can be an excellent decision to preserve your trading capital.
Essentially, this indicator will help you as a quick visual check so if the true volatility of the asset you are following is above or below its average value, indicating whether could be or not an attractive moment to enter a trade. This feature can easily become an essential part of your existing trading system or a tool to build a new one with.
Key features:
- True Statistical Volatility of an asset.
- Moving Average of the asset's volatility.
- Very easy to interpret.
- Very few variables to keep it simple and powerful.
- Widely used tool in professional quantitative trading.
- Source code optimized for extremely efficient calculations.
- Robust and reliable.
It has a very simple interface - just three variables to avoid complexity and overfitting risk if you are using this indicator for algorithmic trading: volatilty period and volatility's average period & method.
Inputs:
- Statistical Volatility for the last N periods: period for calculating the volatility.
- Average Volatility of the last N periods: period for calculating volatility's average.
- Averaging method: method for calculating volatility's average (simple or exponential).
- Volatility Histogram color: color for the histogram.
- Average line color: color for the average line.
本店最新上架
-
- MT4 MT5跟单EA 本地跟单远程跟单 绝不

- ¥1100.00
-
- 在MetaTrader市场购买MetaTrader 5的&#
- ¥3988.00
-
- 在MetaTrader市场购买MetaTrader 5的&#
- ¥3988.00
-
- 在MetaTrader市场购买MetaTrader 5的&#

- ¥3988.00
-
- 在MetaTrader市场购买MetaTrader 5的&#

- ¥3988.00
全网为您推荐
-
- AlgoTradeSoft

- ¥3988.00
-
- 国际期货套利软件

- ¥3988.00
-
- MT4 MT5跟单EA 本地跟单远程跟单 绝不

- ¥1100.00
-
- 在MetaTrader市场购买MetaTrader 5的&#

- ¥3988.00
-
- 在MetaTrader市场购买MetaTrader 5的&#

- ¥3988.00
 客服热线:
客服热线:


