RSL Classic MT4
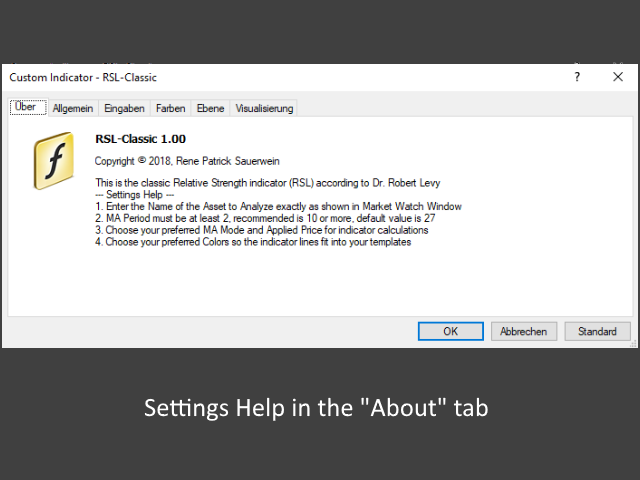
This is the classic "Relative Strength Levy" (RSL) indicator according to Dr. Robert Levy's study called "The Relative Strength Concept of Common Stock Price Forecasting" which was released as a hardcover-book in the late 60's of the last century.
Key Concept
- Use this indicator on several instruments to compare their relative strength: Values resulting from analysis will oscillate around a value of 1
- The strongest instruments will have the highest RSL values (above 1) and the weakest instruments will have the lowest RSL values (below 1)
- You might want to buy the strongest instruments (highest RSL values) and sell the weakest instruments (lowest RSL values) to follow trends
Inputs
- Name of Asset to Analyze - name of the asset exactly as shown in the Market Watch window (i.e. EURUSD, GDAXI, XAUUSD,...)
- MA Periods - length of the look-back period (bars) to be used for the calculations (values >=10 recommended)
- MA Mode - averaging mode from the dropdown menu (Simple, Exponential, Smoothed, Linear Weighted)
- Applied Price - applied price from the dropdown menu (Close, Open, High, Low, Median, Typical, Weighted)
- Color - change the color of the chart to fit your favorite color scheme in your individual templates
Features
- Works on all timeframes
- Works for all instruments that are available in the Market Watch window of your metaTrader 4
- Output value from the buffer is shown in the seperate indicator window and in the Data Window
- The indicator can be used in Expert Advisors using the iCustom() function for automated trading systems
How Dr. Levy used the RSL
Dr. Levy analyzed 200 stocks of the US market (think of the S&P 200 stocks) on a weekly timeframe, and used the output value of his RSL indicator to rank the stocks from strongest (highest RSL values >1) to weakest (lowest RSL values <1). From this resulting ranking list, he bought the Top 5% to 7% of stocks with the highest RSL reading. After a week, he analyzed all of the 200 stocks again, and then re-ranked them according to their RSL reading.
If a stock dropped into the lower 31% of that re-ranked list (he called that "Cast-Out-Rank") he sold the stock, and then redistributed the free capital again amongst the Top 5% to 7% of the latest ranking. This way he was always invested in the strongest stocks available, and re-allocated his capital on a weekly basis according to the RSL ranking list. This is a classic "Momentum" approach and is recommended for medium-term to long-term investors.本店最新上架
-
- MT4 MT5跟单EA 本地跟单远程跟单 绝不

- ¥1100.00
-
- 在MetaTrader市场购买MetaTrader 5的&#
- ¥3988.00
-
- 在MetaTrader市场购买MetaTrader 5的&#
- ¥3988.00
-
- 在MetaTrader市场购买MetaTrader 5的&#
- ¥3988.00
-
- 在MetaTrader市场购买MetaTrader 5的&#

- ¥3988.00
全网为您推荐
-
- AlgoTradeSoft

- ¥3988.00
-
- 国际期货套利软件

- ¥3988.00
-
- MT4 MT5跟单EA 本地跟单远程跟单 绝不

- ¥1100.00
-
- 在MetaTrader市场购买MetaTrader 5的&#

- ¥3988.00
-
- 在MetaTrader市场购买MetaTrader 5的&#

- ¥3988.00
 客服热线:
客服热线:


